
Blog
B2B Marketing Analytics: Why 600 Engaged Accounts Produce Zero SQLs
Your dashboard shows 600 engaged accounts but sales sees nothing. Learn which B2B marketing analytics metrics actually measure pipeline, with cost-per-SQL benchmarks by ACV.
What ABM is, how the process works from target account selection to pipeline, and a deal-size test for whether it makes sense for your B2B SaaS team.
Your dashboard shows 600 engaged accounts but sales sees nothing. Learn which B2B marketing analytics metrics actually measure pipeline, with cost-per-SQL benchmarks by ACV.
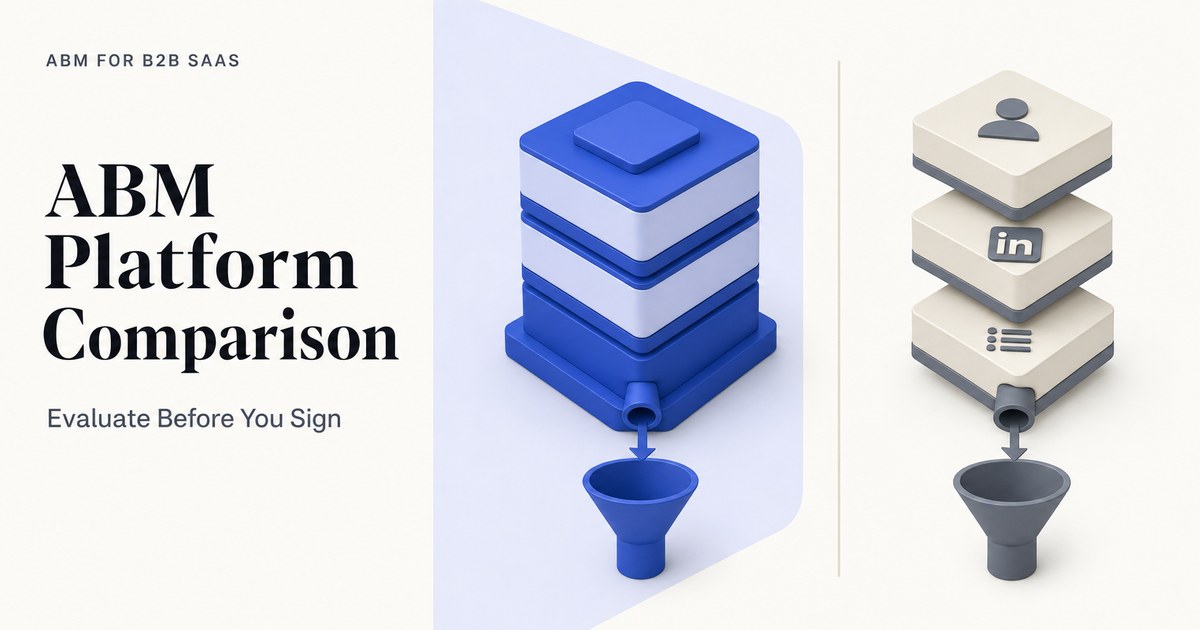
Which ABM software shows pipeline, not just engagement scores? Evaluation criteria, the no-platform option, POC scorecard, and renewal contract terms.
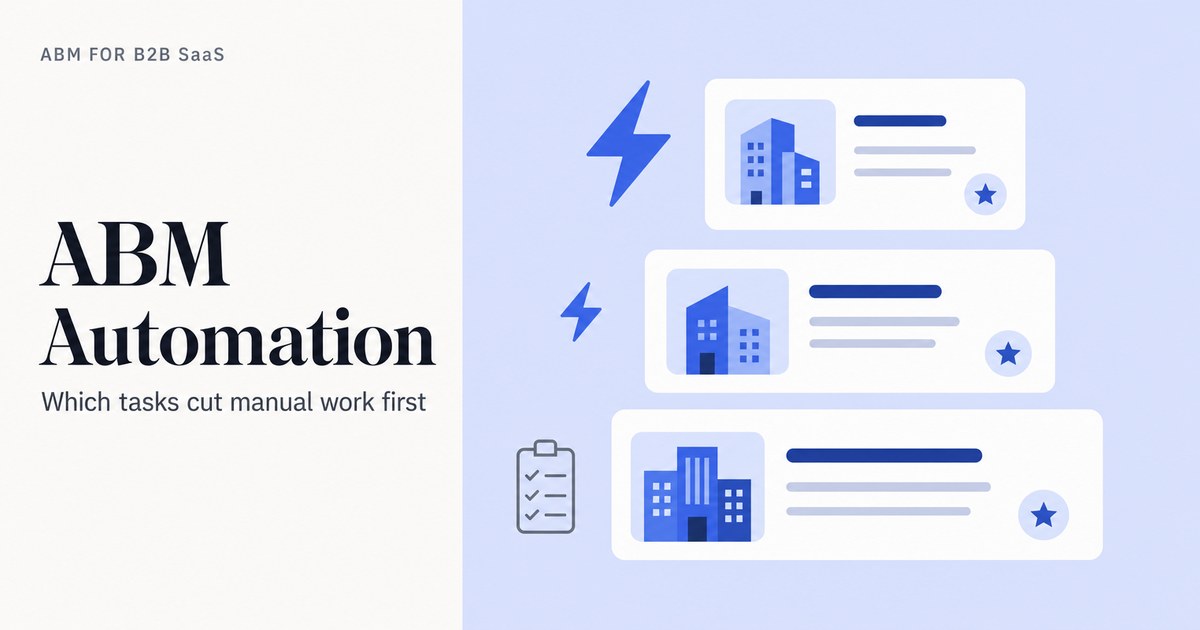
Which account-based marketing automation tasks cut manual work for small ABM teams? A task-by-task guide by deal size, with manual workarounds.
Request a quote and our experts will contact you within 24 hours with tailored solutions and pricing.
abmforb2bsaas.com
Last updated: Oct 17, 2026
Account-based marketing (ABM) for B2B SaaS is a go-to-market approach that focuses sales and marketing resources on a defined list of named companies - target accounts - coordinating outreach across the full buying group and measuring success on pipeline per account, not lead volume.
Most B2B SaaS teams start thinking about ABM when inbound leads dry up or when the leads that arrive come from companies too small to close a meaningful contract. The instinct is right: concentrate resources on the accounts most likely to buy. The challenge is that most ABM guidance was built for enterprise programs with large budgets and dedicated platforms, and it rarely fits a team of two or three people with a list of 200 accounts and a $50K average contract.
This guide gives a plain account of what ABM is, how the process works from account selection to pipeline, and an honest test for whether it makes sense for your deal size and team size. There is a direct section on when ABM is not worth it, covering teams below a $15K annual contract value (ACV) or without a seller working named accounts.
Key Takeaways
- Account-based marketing (ABM) focuses sales and marketing on a defined list of named companies and measures success on pipeline per account, not lead volume or engagement scores.
- Working ABM lists for small teams run 100 to 300 named accounts. Lists of 500 to 2,000+ accounts exceed what a small team can sustain with per-account activity (ABM26, published ranges, no sample stated, as of June 2026).
- A deal worth $25K - $100K involves 5 to 8 stakeholders and a 49 to 84 day sales cycle. ABM must reach all of them, not just the primary champion (BC26, published ranges, no sample stated, as of 2026).
- ABM is not worth it below a $15K ACV or without at least one seller working named accounts full-time.
- The primary ABM metrics are account-to-opportunity rate and pipeline per account, compared against a matched holdout group. Engagement scores are activity metrics, not outcome metrics.
In this guide:
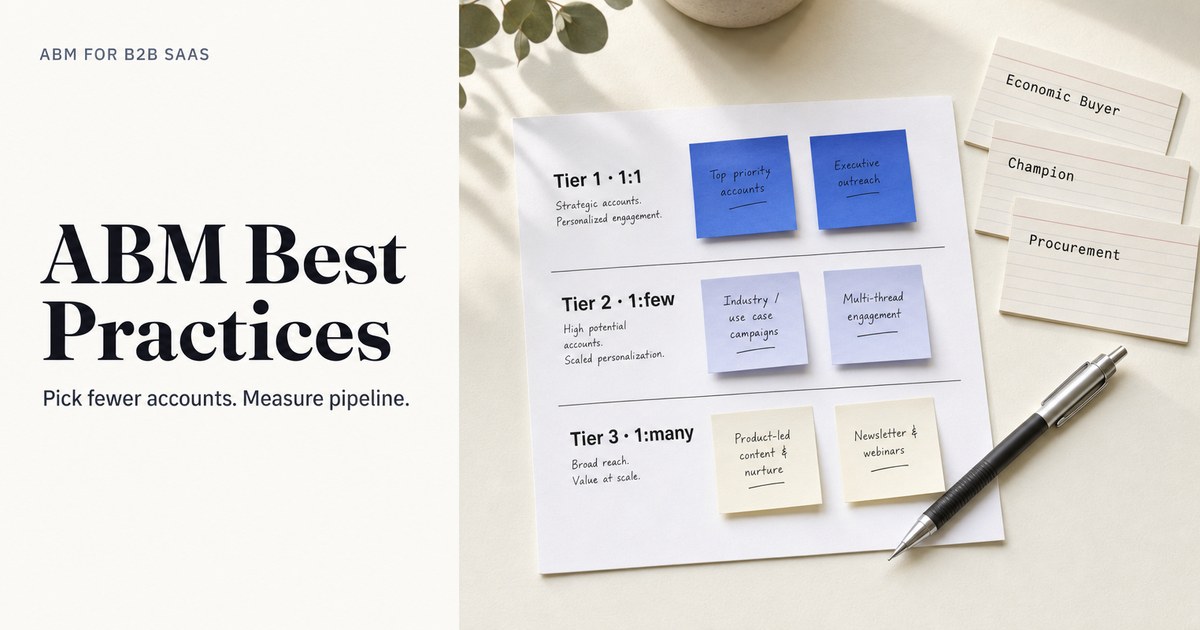
Account-based marketing (ABM) best practices for B2B SaaS center on five principles: build a short, fit-filtered target account list sized to your team; tier accounts into 1:1, 1:few, and 1:many groups; map every buying-group role before spending on outreach; coordinate marketing and sales on named accounts rather than running parallel campaigns; and measure account-to-opportunity rate and pipeline per account, not engagement scores or impressions.

These five principles hold whether a team uses a dedicated platform or runs ABM with a CRM and LinkedIn. They apply at seed stage with a list of 50 accounts and at Series B with a list of 300. The detail changes by deal size and team size. The structure does not.
The term account-based marketing was first defined by ITSMA in the early 2000s as a framework for treating individual accounts as markets of one. The core logic has not changed: select accounts, reach the buying group, measure pipeline.
| Best practice | What it means in practice |
|---|---|
| Build a fit-filtered list | Start from closed-won data and ICP criteria, not raw firmographic exports |
| Tier by treatment capacity | Size each tier to what the team can actually sustain |
| Map the buying group | Identify every stakeholder role before running any outreach |
| Coordinate marketing and sales | One account list, shared between both functions, with agreed roles per tier |
| Measure pipeline per account | Track account-to-opportunity rate against a holdout group |
Account-based marketing (ABM) is a go-to-market approach that concentrates sales and marketing resources on a defined list of named companies - target accounts - rather than broad audience segments. For a B2B SaaS company, ABM means selecting accounts by fit and intent, mapping the buying group, running coordinated outreach across every stakeholder, and measuring pipeline per account. Deals worth $25K - $100K involve 5 to 8 stakeholders over 49 to 84 days (BC26, published ranges, no sample stated, as of 2026).

Account-based marketing (ABM) is a focused revenue strategy, not a channel or a software category. A team can run ABM with a spreadsheet, a CRM, and LinkedIn. A team can also run it with a dedicated platform. The method is the same: pick the accounts, reach the whole buying group, measure pipeline.
Demand generation is a marketing approach that attracts broad audiences using content, paid media, and search, then converts a share of that audience into leads. It optimizes for lead volume and cost per lead. It does not target named companies by default.
ABM and demand generation are not mutually exclusive. Many B2B SaaS teams run demand generation for top-of-funnel volume while applying ABM to the accounts with the highest fit and deal-size potential. The two motions use different success metrics and different list logic.
| Dimension | Demand generation | Account-based marketing |
|---|---|---|
| Audience definition | Persona and interest segments | Named companies (target accounts) |
| Primary success metric | Lead volume, cost per lead | Pipeline per account, account-to-opportunity rate |
| Sales involvement | Leads handed off to sales | Sales and marketing coordinated on each account |
| Buying group coverage | Single persona per campaign | All stakeholders mapped and reached |
| Evaluation timeline | Campaign cycle (weeks) | At least one full sales cycle (49-180+ days) |
| Typical ACV fit | Works across price points | Best above $15K ACV with a sales motion |
Account-based marketing fits when:
Below $15K ACV on a self-serve product with no sales team, the economics rarely justify ABM. That case is addressed directly in the "When ABM is not worth it" section below.
The account-based marketing funnel starts with a defined list of named accounts rather than a broad audience, then expands coverage across the buying group at each account. A traditional demand generation funnel begins wide, attracts large audiences, and filters down to leads. In ABM, progress is measured per account - account-to-opportunity rate and pipeline per account - not by total lead volume or cost per lead.

The demand generation funnel runs top-down: awareness to consideration to decision, with each stage filtering a smaller share of the original audience. Volume at the top predicts volume at the bottom.
The ABM funnel works differently. It is not inverted so much as account-scoped. At every stage, the question is about a named company, not an anonymous visitor.
The key difference from demand generation is that no account enters the funnel as an anonymous lead. Every account is named before any outreach begins. Progress is tracked by account, not by lead.
Account-to-opportunity rate is the share of target accounts that progress from account selection to an open sales opportunity. This is the primary ABM funnel metric.
A target account list for account-based marketing starts from closed-won data and ideal customer profile (ICP) criteria, filtered by fit and intent. Published ranges suggest lists of 100 to 300 named accounts for most small teams, tiered into 10 to 50 accounts for 1:1 treatment, 50 to 200 in 5 to 15 clusters for 1:few, and 200 to 500 for 1:many (ABM26, published ranges, no sample stated, as of June 2026).
The most common ABM list problem is not a bad list - it is a list that is too long. Common ABM lists run 500 to 2,000+ named accounts at companies that should run 100 to 300 (ABM26, published ranges, no sample stated, as of June 2026). With LinkedIn clicks for B2B SaaS running $8 to $25 by vertical (GrowthSpree, June 2026), a list of 1,500 accounts burns budget on companies the team will never follow up on.
A June 2026 audit of 56 LinkedIn accounts covering $9.4M in ad spend found that 20% of spend reached firms under 50 employees (GrowthSpree, June 2026). That is waste caused by a list with no company-size filter applied at the targeting stage.
Ideal customer profile (ICP) is a description of the company type most likely to buy, defined by firmographic and technographic criteria drawn from closed-won data. ICP criteria typically include:
Start with your ten best-fit closed-won accounts. List what they have in common. That pattern is your ICP.
Fit answers: does this company match the ICP? Intent answers: is this company researching a purchase now? Both filters matter. A high-fit account with no intent signal belongs on a 1:few or 1:many list. A high-fit account with strong intent belongs in the 1:1 tier.
Intent signal is any observable behavior suggesting an account is actively researching a category: topic searches, content consumption on review sites, or increased visits to your pricing or product pages.
Published ranges for ABM tier sizes (ABM26, published ranges, no sample stated, as of June 2026):
| Tier | Treatment type | Account count | Content approach |
|---|---|---|---|
| Tier 1 | 1:1 (one-to-one) | 10 to 50 accounts | Bespoke content and outreach per account |
| Tier 2 | 1:few (one-to-few) | 50 to 200 accounts in 5 to 15 clusters | Content per cluster of similar accounts |
| Tier 3 | 1:many (one-to-many) | 200 to 500 accounts | Programmatic tactics across the named list |
Size each tier to what the team can sustain. A team of two cannot run bespoke 1:1 treatment on 50 accounts simultaneously. Start with a smaller Tier 1 and expand when the process is proven.
The account-based marketing process runs in five stages: select target accounts by fit and intent; tier them into 1:1, 1:few, and 1:many; map the buying group per tier; run coordinated, per-tier outreach with aligned sales; then measure account-to-opportunity conversion and pipeline per account against a holdout group. The full cycle takes at least one sales cycle to evaluate-49 to 84 days for $25K - $100K deals (BC26, published ranges, no sample stated, as of 2026).

Apply ICP fit criteria to your total addressable market (TAM) first. Total addressable market (TAM) is the full universe of companies that could buy the product. Then apply intent filters to surface the accounts most likely to buy now. This produces a working list sized to the tiers above.
Assign each account to a tier based on potential deal size and strategic importance. Tier 1 gets the most resource. Tier 3 gets the broadest, lowest-cost treatment. Tier assignment is not permanent - accounts move tiers as fit and intent signals change.
For each tier, identify every stakeholder role the deal depends on. Published ranges for buying group size by deal size (BC26, published ranges, no sample stated, as of 2026):
Map at minimum: the champion (the person driving the evaluation), the economic buyer (the budget holder), and any functional approvers such as procurement, security, and finance. At higher deal sizes, procurement is involved in 62% to 78% of US enterprise deals and 85% to 94% of Indian enterprise deals (BC26, published ranges, no sample stated, as of 2026).
Buying group is the full set of stakeholders whose involvement is required to approve a purchase. Campaigns aimed at one persona miss the other four to fourteen people involved in the decision.
Run outreach by tier with marketing and sales playing distinct but aligned roles:
For channel reach, LinkedIn company-list targeting is a common starting point for ABM. Without exclusions on job function and seniority, non-buying roles consume significant budget: non-buying job functions caused 30% of wasted LinkedIn spend, and individual contributors and entry-level staff consumed 36% of LinkedIn budget across 56 audited accounts as of June 2026 (GrowthSpree, June 2026).
Sales-qualified lead (SQL) is a prospect that has met defined criteria for sales readiness. Target cost-per-SQL benchmarks by annual contract value (ACV) band, as of April 2026 (GrowthSpree, April 2026):
Track account-to-opportunity rate and pipeline per account. Compare results against a holdout group. Do not evaluate the program before at least one full sales cycle has completed.
Total addressable market (TAM) is the ceiling of companies you could sell to, but working account-based marketing lists cover a small fraction of that universe. Published ranges show common ABM lists run 500 to 2,000+ named accounts at companies that should run 100 to 300 (ABM26, published ranges, no sample stated, as of June 2026). A smaller TAM forces prioritization sooner; a large TAM can mask a poorly filtered list.
| TAM size | Practical implication for ABM |
|---|---|
| Under 500 companies | Nearly every company is a named account; prioritize by fit score and intent signal |
| 500 to 5,000 companies | Filter hard on ICP criteria; working list is 10% - 20% of TAM at most |
| 5,000 to 50,000 companies | Apply ICP, intent, and engagement filters; working list stays at 100-500 |
| 50,000+ companies | TAM is likely a market map, not an ABM list; redefine ICP criteria first |
A small TAM (under 500 companies) actually simplifies ABM. Every company is known. The question becomes which ones to prioritize for Tier 1 treatment. A large TAM introduces the risk that the list never gets filtered, producing a 1,500-account list that three people cannot meaningfully work.
The right question is not "how many accounts are in our TAM?" It is "how many accounts can the team give meaningful treatment to each quarter?" That answer determines the working list size. The TAM determines only the pool to draw from.
Account-based marketing requires sales and marketing to operate from the same named-account list, with agreed roles per account tier. Marketing creates awareness and content for the buying group; sales works named stakeholders directly. Without a seller assigned to each 1:1 account, ABM produces content nobody follows up on. Procurement is involved in 62% - 78% of US enterprise deals and 85% - 94% of Indian deals (BC26, published ranges, no sample stated, as of 2026).
Sales coordination is the practice of aligning marketing outreach and sales activity to the same named accounts, with shared visibility into account status and agreed handoffs. Without it, marketing sends "engaged accounts" that sales has never heard of, and sales works accounts that marketing has never reached.
Tier 1 (1:1): One seller owns each account. Marketing produces account-specific content on request. Both teams track the account in the CRM with shared notes on stakeholder status.
Tier 2 (1:few): Sales development representatives (SDRs) work clusters. Marketing produces content per cluster. Outreach sequences are agreed in advance and not duplicated between functions.
Tier 3 (1:many): Marketing runs programmatic outreach. Sales monitors for accounts that upgrade from Tier 3 to Tier 2 based on intent signals.
A June 2026 audit of 56 LinkedIn accounts covering $9.4M in ad spend found that decision-makers received only 33% of ad budget, against a target of 60% or more (GrowthSpree, June 2026). That gap between target and actual reflects campaigns run without buying-group targeting rules agreed with sales before launch.
The symptom sales leaders describe most often: "Marketing sends 600 engaged accounts. None of them are in my pipeline." The fix is not a better platform. It is a shared account list with buying-group roles defined before any channel goes live.
Account-based marketing is not worth it for B2B SaaS teams when annual contract value (ACV) is below $15K, because the cost of coordinating across multiple stakeholders per account typically exceeds the return at that price point. It also fails without a seller actively working named accounts, and without a list small enough to treat each account individually. Self-serve SaaS products with no sales motion sit outside the scope of ABM entirely.
This is not a caveat buried at the end. It is a structural limit. ABM is not the right answer for every B2B SaaS company, and applying it in the wrong context wastes budget that could go toward demand generation or product-led growth.
Ask these four questions before starting an ABM program:
The primary account-based marketing metrics are account-to-opportunity rate and pipeline per target account, compared against a matched holdout group that received no ABM treatment. Engagement scores and accounts reached are activity metrics that do not show revenue contribution. In 56 LinkedIn accounts audited as of June 2026, decision-makers received only 33% of ad budget against a target of 60% or more (GrowthSpree, June 2026) - showing how activity metrics can mask poor targeting throughout a program.
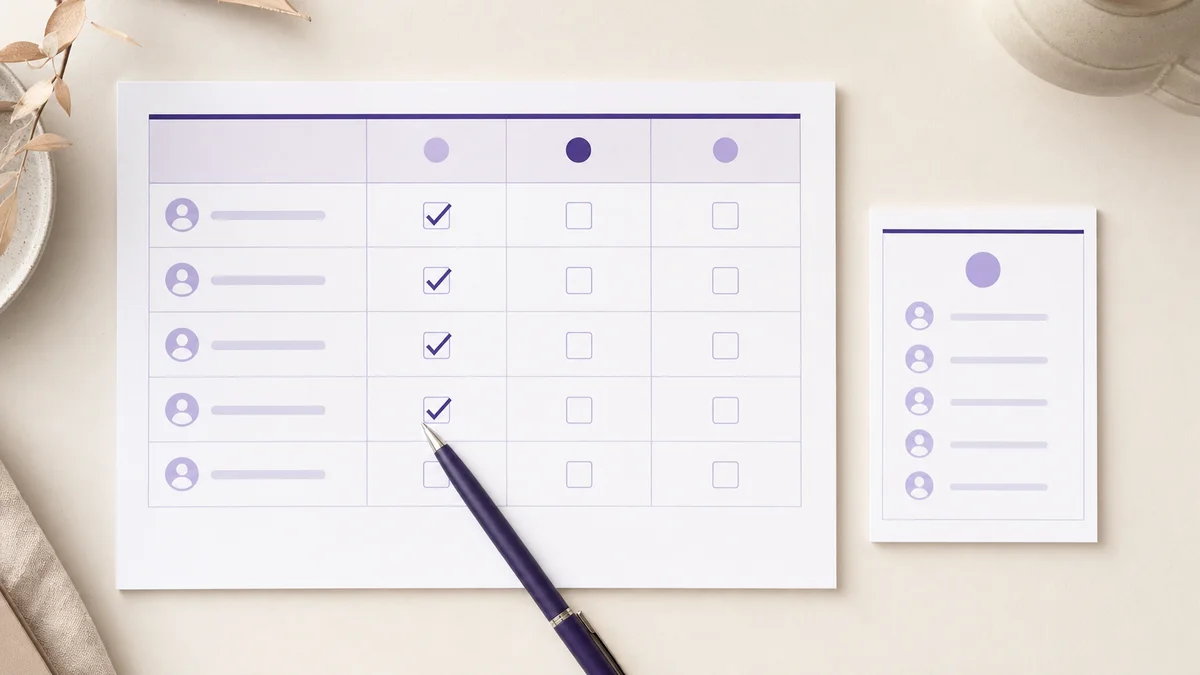
Holdout accounts are a matched set of accounts deliberately excluded from ABM treatment, used as a control group to measure the incremental effect of the program on pipeline. Without a holdout group, it is impossible to separate ABM's contribution from broader market trends or sales effort.
| Activity metric | Why it does not measure ABM success |
|---|---|
| Accounts reached | Reach does not equal pipeline |
| Engagement score | Aggregates platform activity, not buying intent |
| Impressions and clicks | Channel efficiency metrics, not program outcomes |
| MQL volume from target accounts | Conflates ABM contacts with non-buying roles |
Do not evaluate ABM on pipeline before at least one full sales cycle has completed. That is 49 to 84 days for $25K - $100K deals, 84 to 126 days for $100K - $250K deals, and 126 to 180 days for $250K - $1M deals (BC26, published ranges, no sample stated, as of 2026). Programs reviewed at 30 days produce premature conclusions and premature cancellations.
Account-based marketing (ABM) is a go-to-market approach that focuses sales and marketing effort on a defined list of named companies - called target accounts - rather than broad audiences. ABM coordinates outreach across every stakeholder in the buying group at each account and measures success on pipeline created and opportunities opened, not impressions or engagement scores.
A traditional demand generation funnel starts wide, attracting large audiences and filtering down to leads. The account-based marketing funnel starts with a short list of named accounts that already meet fit criteria, then expands coverage across the buying group at each account. Progress is measured per account - account-to-opportunity rate and pipeline per account - not by lead volume.
The account-based marketing process runs in five stages: define your ideal customer profile and select target accounts; tier accounts into 1:1, 1:few, and 1:many groups; map the buying group at each account; run coordinated marketing and sales outreach by tier; then measure account-to-opportunity conversion and pipeline per account. Published ranges suggest 10 to 50 accounts in the 1:1 tier (ABM26, published ranges, no sample stated).
Total addressable market (TAM) size sets the ceiling, but working ABM lists are far smaller. If your TAM contains 10,000 companies, an ABM program selects the highest-fit, highest-intent subset - typically 100 to 300 named accounts for a small team. Lists of 500 to 2,000+ accounts are common but exceed what a small team can sustain with meaningful per-account activity (ABM26, published ranges, no sample stated).
Start with a fit-based account list of 50 to 150 companies from your closed-won data and ICP criteria. Tier it into 1:1 (10 to 50 accounts), 1:few (50 to 200), and 1:many (200 to 500). Map the buying group per tier. Align one seller to each 1:1 account. Measure pipeline per account after at least one full sales cycle-49 to 84 days for $25K - $100K deals (BC26, published ranges, no sample stated).
Demand generation targets audiences defined by persona and interest, optimizing for lead volume. Account-based marketing targets a defined list of named companies and measures success per account - pipeline created and opportunities opened at each named account. The two are not mutually exclusive: many B2B SaaS teams run demand generation alongside ABM, applying ABM to accounts with the highest fit and annual contract value potential.
Account-based marketing is not worth it when annual contract value (ACV) is below $15K, because the cost of reaching and coordinating across multiple stakeholders per account typically exceeds the return. It also fails without at least one seller working named accounts full-time, or without a list small enough to treat each account individually. Self-serve SaaS products with no sales motion sit outside the scope of ABM.
The primary metrics for account-based marketing are account-to-opportunity rate (the share of target accounts that open an opportunity) and pipeline per target account, both compared against a matched holdout group that received no ABM treatment. Engagement scores and accounts reached are activity metrics, not outcome metrics. Do not evaluate ABM on pipeline before at least one full sales cycle has completed.
Account-based marketing for B2B SaaS produces pipeline when the five practices in this guide work together: a fit-filtered account list, tiered treatment, buying-group mapping, sales coordination, and pipeline measurement against a holdout group. Skipping one undermines the others. A perfectly tiered list fails without sales coordination. Sales coordination fails without the right measurement to show what is working.
Three concrete steps to take now:
A free consultation. Bring your target account list and brainstorm the next step with an ABM expert.
Meet with an expert
ABM for B2B SaaS Editorial Team. Last updated: October 13, 2026.
Sources: L26-The State of Wasted LinkedIn Ads Spend in B2B SaaS (GrowthSpree, June 2026; 56 accounts, $9.4M in spend analyzed). B26-SaaS Google Ads Benchmarks 2026 (GrowthSpree, April 2026). BC26-B2B SaaS Buying Committee Size Benchmarks 2026 (GrowthSpree; published ranges, no sample stated). ABM26-Most B2B SaaS ABM Programs Are Spray-and-Pray With Lipstick (GrowthSpree, June 2026; practitioner argument, no sample stated).
© 2026 abmforb2bsaas.com All rights reserved.