
Blog
Sales Conversion Rates by Deal Size and Funnel Stage: 2026 B2B SaaS Benchmarks
Published B2B SaaS sales conversion rates by ACV band: win rates from 12% to 35%, stage-by-stage funnel benchmarks, and how to project pipeline.
Attribution models compared by deal size, sales cycle and buying group. What first-touch, last-touch, U-shaped and W-shaped each measure and where they fail.
 Ishan ManchandaNov 4, 2026

Published B2B SaaS sales conversion rates by ACV band: win rates from 12% to 35%, stage-by-stage funnel benchmarks, and how to project pipeline.
Intent scores reset weekly and most ABM teams have no owner or action tied to them. Here is the workflow to act on real-time buying signals before the window closes.
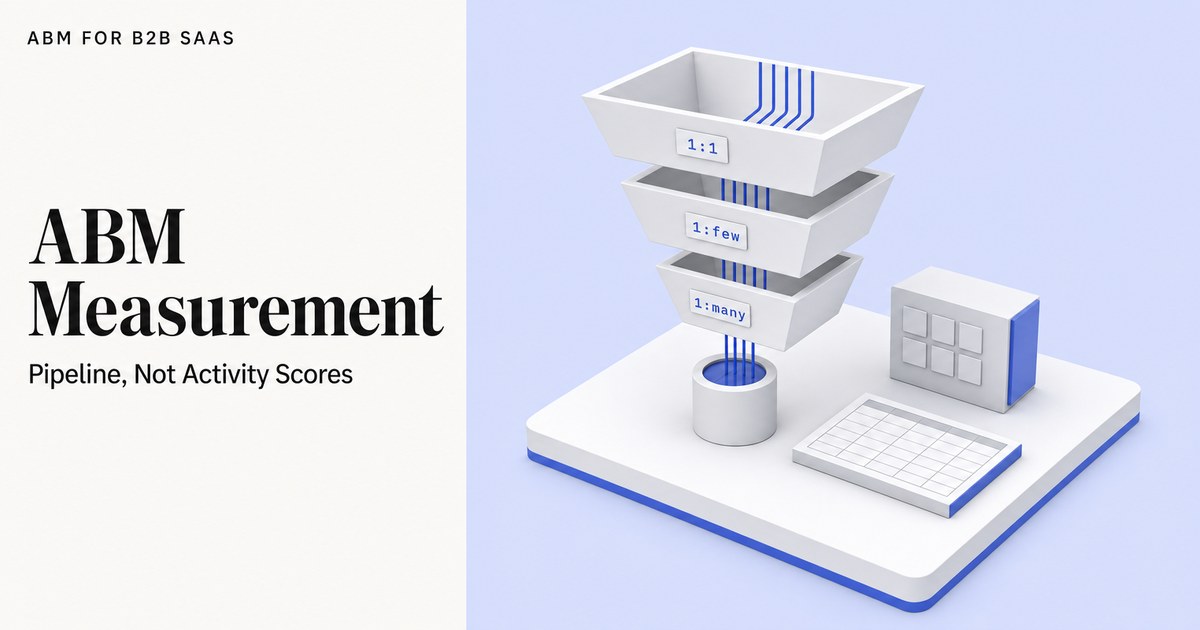
Stop tracking engaged accounts. Rebuild ABM measurement around account-to-opportunity rate and pipeline per target account, tiered by 1:1, 1:few, and 1:many.
Request a quote and our experts will contact you within 24 hours with tailored solutions and pricing.
ABM for B2B SaaS
Last updated: Nov 4, 2026
By the ABM for B2B SaaS Editorial Team, following the site's Methodology page. Last updated October 28, 2026. Every figure on this page names its source, and vendor data is labelled as vendor data.
Attribution models are rules that assign credit for a closed deal to the marketing and sales touches that came before it, and the main types differ in which touches they count and how much credit each receives. In B2B SaaS the choice has real consequences. The average B2B journey now runs 272 days with 10 stakeholders (Dreamdata, PR Newswire, 2026), so a model that credits one click from one person leaves most of the buying group invisible to sales. This guide maps each model to deal size and sales cycle length, and flags where each stops giving useful signal. It also covers the account-level view that account-based marketing (ABM) teams need, explored further in the ABM attribution guide.
Key Takeaways
- Attribution models split credit for a deal across earlier touches: first-touch and last-touch credit one moment, while U-shaped and W-shaped models credit several milestones.
- B2B SaaS deals above $100K in annual contract value (ACV) run 90 to 180+ days (Optifai, 2026), which is longer than many default attribution windows cover.
- The average B2B journey reached 272 days, 88 touchpoints and 10 stakeholders in 2026 (Dreamdata, PR Newswire, 2026), so single-touch credit misses most of the buying group.
- No rule-based attribution model shows which buying group member moved a deal. That needs opportunity contact-role data and, ideally, holdout accounts.
- Attribution modeling is not always worth building: low deal volume or messy CRM data makes a simple baseline the better choice.
The main marketing attribution models are first-touch, last-touch, linear, time-decay, U-shaped and W-shaped, and each is a rule for splitting credit for a closed deal across earlier touches. Single-touch models credit one moment, while multi-touch models spread credit across the journey. Only 40% of organizations completely trust their measurement (BCG/Google study, via milan-novotny.com, 2025), and no rule shows which buying group member changed the outcome.

An attribution model is a rule set that assigns credit for a closed deal to the marketing and sales touches that came before it. The table below lists the six most common marketing attribution models, what each measures and where each stops being useful.
| Model | What it measures | Credit rule | Useful when | Breaks down when |
|---|---|---|---|---|
| First-touch | Which channel starts a relationship | 100% to the first recorded touch | The cycle is short and one buyer decides | Many stakeholders enter after the first touch |
| Last-touch | What triggers a conversion | 100% to the final touch before conversion | Purchases are quick and low-consideration | Months of earlier influence go uncredited |
| Linear | Breadth of engagement | Equal credit to every touch | A rough view of all channels is enough | Low-value touches get the same weight as key ones |
| Time-decay | Momentum near the close | More credit to touches nearer the deal | Late-stage activity drives the outcome | Early research, where B2B deals form, is discounted |
| U-shaped | Origination and conversion | Heavy credit to first touch and lead creation, the rest shared | Cycles run months and the CRM tracks lead creation | Activity after lead creation is mostly ignored |
| W-shaped | Three milestones in the journey | Heavy credit to first touch, lead creation and opportunity creation, the rest shared |
First-touch attribution is a single-touch model that gives 100% of the credit to the first recorded interaction. It answers one question: which channel started the relationship. Last-touch attribution is a single-touch model that gives 100% of the credit to the final interaction before conversion. It answers a different question: what pushed the buyer over the line.
Both are easy to run and easy to explain. That is why they dominate dashboards, including those used by demand generation programs. The cost is that each ignores everything else. In a multi-stakeholder deal, everything else is most of the story.
Linear attribution is a multi-touch model that splits credit equally across every recorded touch. Time-decay attribution is a multi-touch model that gives more credit to touches closer to the conversion. U-shaped attribution credits first touch and lead creation heavily, with the remainder shared across other touches. W-shaped attribution adds a third heavy milestone at opportunity creation.
Vendors define the shaped models differently. One vendor's W-shaped model is another's U-shaped, so check the credit weights before comparing reports.
Single-touch attribution models break on multi-stakeholder B2B SaaS deals because they credit one touch from one person, while the purchase involves many people over many months. Dreamdata's 2026 benchmark puts the average B2B journey at 272 days, 88 touchpoints and 10 stakeholders (Dreamdata, PR Newswire, 2026), up from 211 days and 6.8 stakeholders in 2024.

Dreamdata sells attribution software, so its benchmark is vendor data, not independent research. Its dataset covers 66 million sessions across 3.5 million customer journeys, and the journey runs from first anonymous touch to closed revenue. That is longer than a CRM opportunity-to-close cycle.
Dreamdata's 2026 benchmark also reports that buyers spend the first 220 days of the 272 day journey forming decisions through content and self-education before entering the sales pipeline (Dreamdata, EQS, 2026). Dreamdata's CMO put the consequence bluntly: "B2B deals are essentially won before sales get involved in the process." (Steffen Hedebrandt, Dreamdata, 2026)
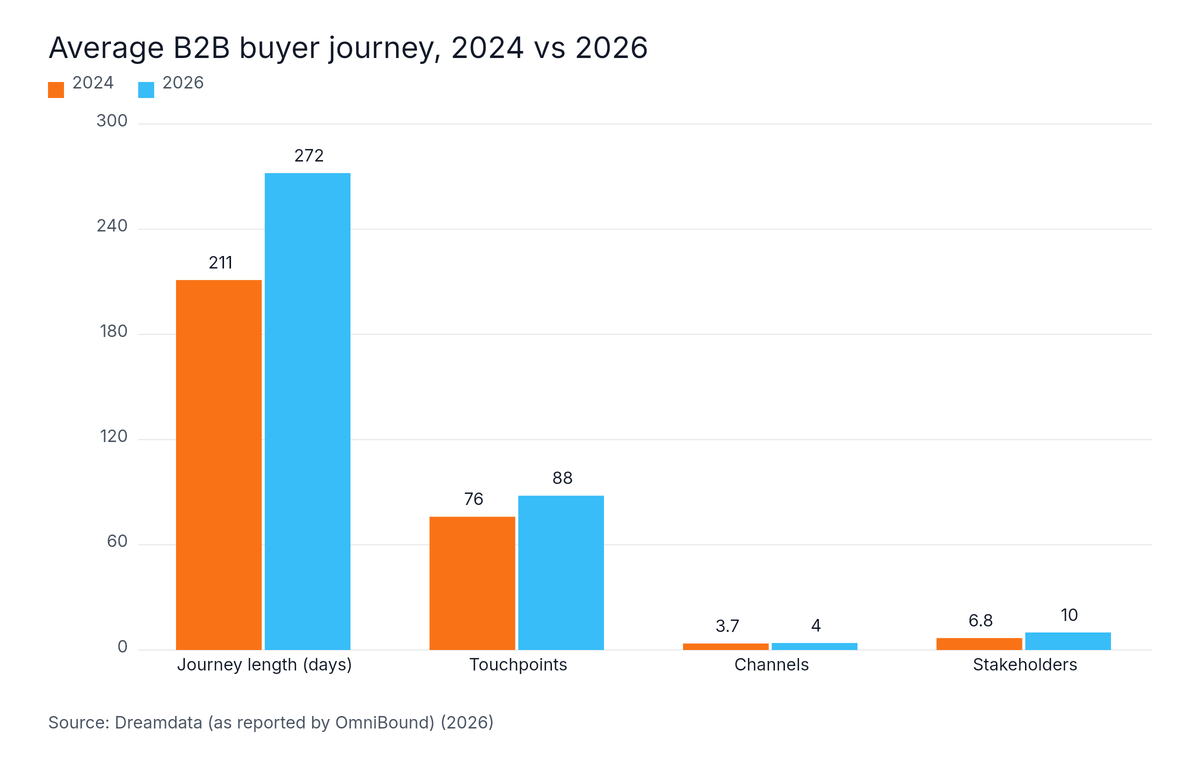
Source: Dreamdata (as reported by OmniBound), 2026
The average B2B journey, 2024 versus 2026, as measured by Dreamdata and reported by OmniBound (2026): journey length rose from 211 to 272 days, touchpoints from 76 to 88, channels from 3.7 to 4, and stakeholders from 6.8 to 10.
Three problems follow from those numbers:
Forrester's own 2026 survey puts the typical decision at 13 internal stakeholders plus nine external influencers (Forrester, 2026). Reporting built on one touch tends to produce the pattern described in why 600 engaged accounts produce zero SQLs: plenty of activity, little pipeline.
Attribution model fit depends on deal size and sales cycle length. Optifai's study of 939 B2B SaaS companies puts deals over $100K ACV at 90 to 180+ days and the $15K to $100K band at 30 to 90 days (Optifai, 2026). The longer the cycle, the more a team needs account-level, multi-touch credit instead of single-touch credit.

The matrix below applies those cycle bands to the models. The "models that give useful signal" column is editorial judgment based on how each model credits touches, not a measured result. Optifai is the only sourced cycle anchor. The planning ranges are the site's own working figures with no stated sample. They follow the account tier logic in the ABM best practices guide.
| ACV band | Sales cycle and committee size | Models that give useful signal | Where signal runs out |
|---|---|---|---|
| Under $15K | No sourced cycle figure; editorial judgment only | First-touch and last-touch | One buyer usually decides, so a richer model rarely adds signal |
| $15K to $100K | 30 to 90 days (Optifai, 2026) | First-touch and last-touch as a pair, plus linear or time-decay | Single-touch models alone hide the second and third stakeholders |
| $100K to $250K | 90 to 180+ days for deals over $100K (Optifai, 2026); site planning range of 84 to 126 days and 7 to 10 stakeholders, no stated sample | U-shaped or W-shaped, rolled up to the account | Single-touch models give insufficient signal; shaped models stop at opportunity creation |
| $250K and above | 90 to 180+ days (Optifai, 2026); site planning range of 126 to 180 days and 10 to 15 stakeholders for $250K to $1M, no stated sample | W-shaped plus opportunity contact-role credit and a self-reported source | Any model without account-level and contact-level data cannot show who moved the deal |
First-party figures (ABM for B2B SaaS evidence pack): ABM for B2B SaaS's planning ranges, which carry no stated sample, put 5 to 8 stakeholders and 49 to 84 day cycles at $25K to $100K deals, 7 to 10 stakeholders and 84 to 126 days at $100K to $250K, and 10 to 15 stakeholders and 126 to 180 days at $250K to $1M. Target cost per sales-qualified lead (SQL) runs $1,000 to $3,000 for $15K to $50K ACV, $3,000 to $8,000 for $50K to $150K ACV and $8,000 to $20,000 for $150K+ ACV (GrowthSpree, April 2026). A model is useful for a band only if its pipeline report can be checked against a cost per SQL in that range.
No single authoritative cycle-length figure exists. Optifai's study (Q2 2025 to Q1 2026) reports a median of 84 days across all deal sizes (Optifai, 2026). Its band ranges are 25th to 75th percentile. Optifai sells sales software, so treat its numbers as vendor data. The 84 day median spans all deal sizes and is not a figure for any single band.
The site's planning ranges sit lower than Optifai's 90 to 180+ days for deals over $100K ACV, and they have no stated sample. Where they differ, use the Optifai range as the better-documented anchor. In plain terms, the larger the deal, the further the cycle outruns a short attribution window.
W-shaped attribution is a multi-touch model that gives most credit to three milestones: first touch, lead creation and opportunity creation. A common vendor split, reported by Improvado (2026), is 30% to each milestone and 10% to the remaining touches. It works only where the CRM records those milestones, and it stops at opportunity creation.
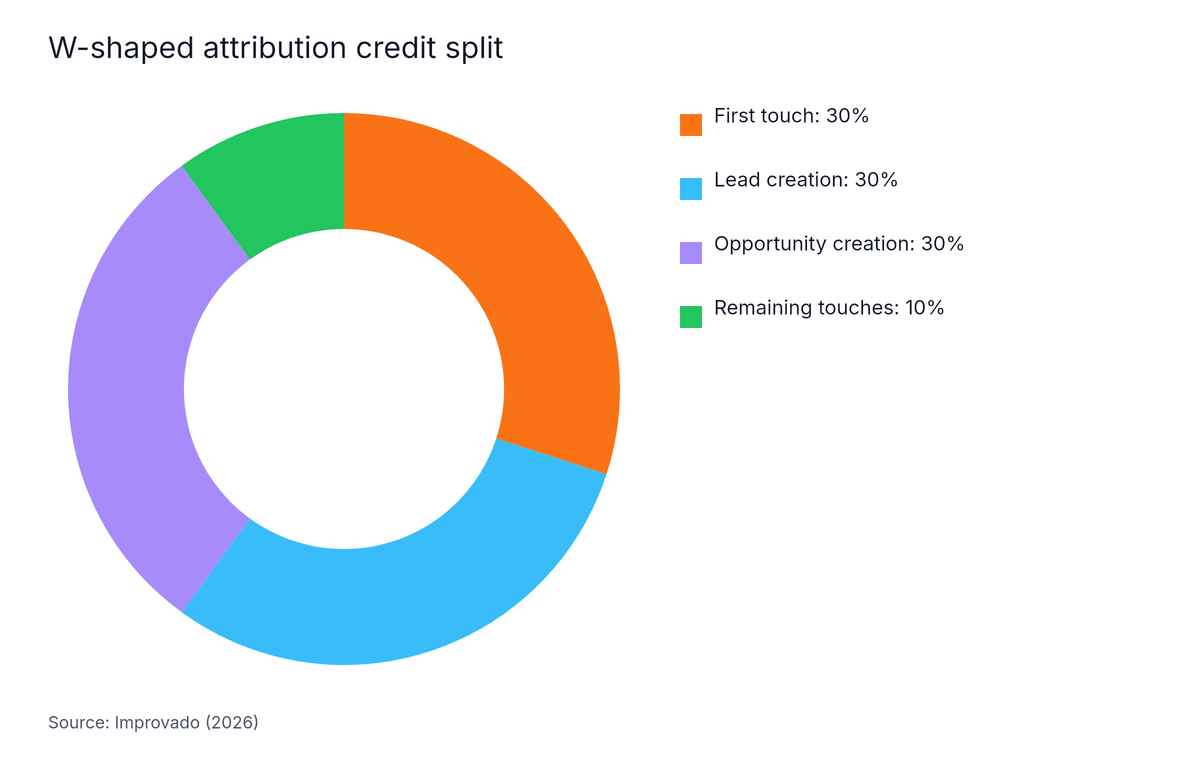
Source: Improvado, 2026
The chart shows the 30/30/30/10 split (Improvado, 2026). That split is a vendor convention, not a standard, and other vendors weight the milestones differently. W-shaped suits a $100K+ motion better than single-touch because it credits the lead and the opportunity, not just the first or last click.
An attribution window is the period before a conversion in which touches can still earn credit. Many platform defaults are far shorter than a 90 to 180+ day cycle, so early touches fall outside the window. Match the window to the sales cycle, not the platform default.
Crediting individual buying group members requires opportunity contact-role data, not just campaign touches. Forrester reports "The typical buying decision now includes 13 internal stakeholders and nine external influencers" (Forrester, 2026), so a model that credits one lead record misses most of the people who shaped the deal.

A buying group is the set of people inside and outside a company who take part in a purchase decision. An opportunity contact role is a CRM field that records which contacts are involved in a deal and what part each plays. Those two ideas together are the basis for contact-level credit.
Published counts vary because each source counts different people.
| Source | Count | What is counted |
|---|---|---|
| Dreamdata, 2026 | 10 stakeholders | Average per journey across its platform data (vendor data) |
| Forrester, 2026 | 13 internal stakeholders plus nine external influencers | Internal and external reported separately; not to be added into one number |
| Gartner, May 2025 | 5 to 16 people across up to four functions | Buying group range (Gartner, 2025) |
| ABM for B2B SaaS planning range | 7 to 10 stakeholders for $100K to $250K deals | Site's own range, no stated sample |
Gartner's release also reported that 74% of buyer teams show unhealthy conflict during decisions (2025). A deal with that much internal debate is shaped by people a single-touch report never records. Quote a stakeholder count only with its source and counting rule.
First-party figures (ABM for B2B SaaS evidence pack): In a June 2026 audit of 56 LinkedIn accounts covering $9.4M in ad spend (GrowthSpree), decision-makers received 33% of budget against a target of 60% or more, and individual contributors and entry-level staff consumed 36%. Budget reaching the wrong roles is a targeting finding, and it shows why touches and spend should be reported by role before anyone reads them as buying group coverage.
ABM for B2B SaaS treats pipeline per account and account-to-opportunity rate as the primary measures. The ABM attribution guide shows how account-level credit works when several channels hit the same account.
Rule-based attribution models miss any influence that leaves no tracked touch, such as private research, peer conversations and early self-education. The BCG/Google Global Measurement Study of 3,140 organizations found that 81% run attribution but only 40% completely trust what it tells them (milan-novotny.com, 2025). Added methods fill the gap.
The BCG/Google Global Measurement Study, reported through a secondary stats page, found that only 46% of organizations run attribution, marketing mix modeling and incrementality testing together (milan-novotny.com, 2025). It covers all marketers, not B2B SaaS only.
Practitioner guidance in 2026 has moved from picking one model to stacking methods: rule-based credit, a self-reported field and, at higher maturity, incrementality testing. Each answers a different question. Rule-based models show tracked paths, self-reported data shows memory and testing shows cause.
Attribution modeling is not worth building when deal volume is too low for patterns to emerge, when the CRM lacks clean milestone and contact-role data, or when no one will act on the output. Only 40% of organizations completely trust their measurement (milan-novotny.com, 2025), so models on thin data deserve extra scepticism. A first-touch and last-touch pair plus a self-reported source field is cheaper and more honest.

A customer relationship management (CRM) system defaults to last-touch because the most recent source is the easiest value to store and report. This is an editorial explanation, not a measured finding. Changing it means recording milestone dates and contact roles, then picking a multi-touch model in the reporting layer.
No public source reviewed for this article states a reliable minimum number of closed deals for multi-touch credit, so any fixed threshold should be treated with caution. The practical test is whether the same credit pattern repeats across quarters. If it does not, the model is reporting noise.
For teams deciding where attribution fits against inbound programs, the comparison in ABM versus inbound marketing covers stage and deal size.
A B2B SaaS team should choose an attribution model by matching it to deal size, sales cycle and data quality, then roll it out in stages. Start with first-touch and last-touch as a baseline, add U-shaped or W-shaped credit once the CRM records clean milestones, and layer account-level credit and holdout accounts as deals grow past $100K.
B2B SaaS teams use first-touch, last-touch, linear, time-decay, U-shaped and W-shaped attribution models. For a long, multi-stakeholder deal, W-shaped or account-level multi-touch credit fits best because it gives weight to lead creation and opportunity creation, not just the first or last click. Deals above $100K ACV also need opportunity contact-role data to show which buying group members mattered.
Neither first-touch nor last-touch attribution is better for B2B SaaS on its own, because each credits a single touch from a single person. First-touch shows which channels start relationships, and last-touch shows what triggers a conversion. Used together as a baseline they give a floor reading for shorter, smaller deals, but they cannot explain a long, multi-stakeholder purchase.
An attribution window for enterprise SaaS should be at least as long as the sales cycle, which Optifai puts at 90 to 180+ days for deals over $100K ACV. Dreamdata reports buyers spend the first 220 days of a 272 day journey before entering the pipeline, so a window shorter than the cycle misses most of the early touches.
U-shaped attribution credits two milestones, first touch and lead creation, while W-shaped attribution adds a third, opportunity creation. Improvado (2026) describes a W-shaped split of 30% to each of the three milestones and 10% to the remaining touches. Vendors set U-shaped and W-shaped weights differently, so check the credit weights before comparing reports.
CRM systems default to last-touch attribution because the most recent source is the easiest value to store and report, and it needs no extra setup. This is an editorial explanation, not a measured finding. Changing it means recording milestone dates and contact roles, then choosing a multi-touch model in the reporting layer.
Multi-touch attribution needs enough closed deals for credit patterns to repeat, plus clean milestone and contact-role fields. No public source reviewed for this article states a reliable minimum deal count, so any fixed threshold should be treated with caution. Teams with few closed deals a year are better served by a baseline pair and manual buying group notes.
Self-reported attribution, a form field on a demo request that asks buyers how they found the company, cannot replace multi-touch models, because it captures what buyers remember rather than what they touched. It does reveal private research and word of mouth that tracking misses. Practitioner guidance is to stack it with rule-based models, and to add incrementality testing as measurement matures.
Attribution models answer different questions, and none of them answers the one B2B SaaS sales teams care about most: which buying group members moved the deal. The best choice depends on deal size, cycle length and data quality.
For the account-level view, start with the ABM attribution guide. To test which model fits a specific deal size and target account list, Meet with an expert for a free consultation, and bring your target account list so the next step can be worked out together with an ABM expert.
Written by
Ishan Manchanda
Ishan Manchanda is co-founder of GrowthSpree, a B2B SaaS marketing consultancy founded in 2017 that has managed $60M+ in ad spend across 300+ B2B SaaS companies. He focuses on demand generation, go-to-market strategy and pipeline growth, and has been featured in Silicon Valley Times, SaaS Mag and the Unbounce podcast.
© 2026 ABM for B2B SaaS All rights reserved.


| The CRM logs opportunity creation reliably |
| Anything before the lead record, or after the opportunity, is thin |