Blog
ABM Platform and Software Comparison: What to Evaluate Before You Sign
Which ABM software shows pipeline, not just engagement scores? Evaluation criteria, the no-platform option, POC scorecard, and renewal contract terms.
Your dashboard shows 600 engaged accounts but sales sees nothing. Learn which B2B marketing analytics metrics actually measure pipeline, with cost-per-SQL benchmarks by ACV.

Which ABM software shows pipeline, not just engagement scores? Evaluation criteria, the no-platform option, POC scorecard, and renewal contract terms.
Which account-based marketing automation tasks cut manual work for small ABM teams? A task-by-task guide by deal size, with manual workarounds.

Firmographic data defines your ICP by company size, industry, revenue and headcount. Learn how B2B SaaS teams use it to build ABM lists of 100-300 accounts.
Request a quote and our experts will contact you within 24 hours with tailored solutions and pricing.
Last updated: Oct 16, 2026
ABM for B2B SaaS Editorial Team
B2B marketing analytics is the practice of connecting marketing activity to revenue outcomes: pipeline created, opportunities won, and cost per sales-qualified lead (SQL), not the volume of accounts that clicked, opened, or visited a page.
If your dashboard shows 600 engaged accounts and sales reports nothing changed, the analytics setup is measuring reach, not influence. That gap is common: pipeline generated is the top marketing metric in 62% of B2B technology companies, yet only 52% of teams actually measure marketing cost per pipeline (Benchmarkit, 2025). This page explains what separates activity metrics from pipeline metrics, provides cost-per-SQL benchmarks by annual contract value (ACV) band, and covers how to segment email and reporting by account tier and buying group role.
Key Takeaways
- Engagement scores and accounts reached are activity metrics. Account-to-opportunity rate and pipeline per target account are outcome metrics. Only the second set answers whether account-based marketing (ABM) is working.
- Published cost-per-SQL benchmarks range from $1,000 to $3,000 for $15K to $50K ACV contracts, up to $8,000 to $20,000 for $150K+ ACV contracts (GrowthSpree [B26], April 2026).
- B2B SaaS win rates fell to 19% in 2025, down from 29% in 2024 (Ebsta × Pavilion GTM Benchmarks 2025), making pipeline coverage ratios more demanding than ever.
- Email segmentation by account tier and buying group role requires two CRM fields on every contact: tier (T1/T2/T3) and role (economic buyer, technical evaluator, champion, procurement).
- A matched holdout group of non-treated accounts is the only reliable way to isolate ABM's contribution from background pipeline noise.
B2B marketing analytics is the practice of connecting marketing activity to revenue outcomes: pipeline created, opportunities won, and cost per sales-qualified lead (SQL). Most dashboards instead measure reach and engagement. Those are activity metrics. Pipeline metrics measure whether target accounts moved to a qualified opportunity. Only 52% of B2B marketing teams measure marketing cost per pipeline, per Benchmarkit's 2025 survey of 323 B2B technology companies.

The gap between the two measurement types is structural. An engagement platform records that an account triggered a score threshold. A pipeline analytics setup records that a sales-qualified lead (SQL) was created at that account, when it happened, and which marketing touches preceded it. These are different data models, often living in different tools.
Activity metrics include:
Pipeline metrics include:
Pipeline generated is the number-one marketing metric in 62% of B2B SaaS companies (Benchmarkit, 2025). Pipeline velocity has replaced MQL volume as the primary demand metric reported to executives in 71% of B2B marketing organizations (The Starr Conspiracy, 2025).
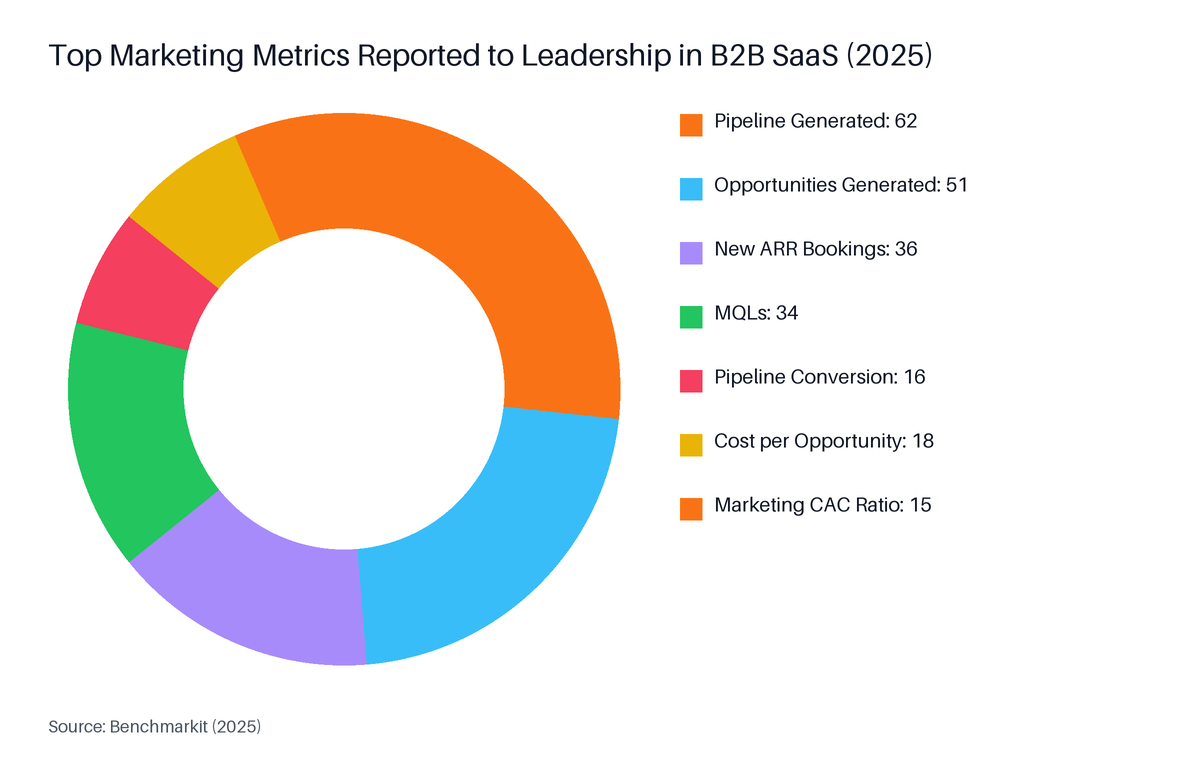
Source: Benchmarkit, 2025
As The Starr Conspiracy put it in their September 2025 measurement trends report: "If your dashboard still leads with last-touch credit, you are measuring vibes, not revenue" (The Starr Conspiracy, 2025).
High engagement with zero sales-qualified leads (SQLs) means the analytics setup is measuring reach rather than buying-group activation. Buyers spend only 17% of their total B2B purchase time meeting suppliers, per Gartner's 2025 buying journey research. The rest is independent research and internal deliberation that never appears in an engagement dashboard. Three structural failures explain the gap: the wrong people are engaging, the account list is too large, and the buying group is wider than the campaign assumes.

Engagement dashboards rarely distinguish between an economic buyer and an analyst who downloaded a white paper out of curiosity. In a GrowthSpree audit of 56 LinkedIn accounts covering $9.4M in ad spend (June 2026), decision-makers received only 33% of LinkedIn ad budget against a target of 60% or more. Individual contributors and entry-level staff consumed 36% of budget. Non-buying job functions caused 30% of wasted spend.
If the engagement numbers are driven by non-buyers, no volume of engagement signals will produce an SQL. The fix is not a bigger budget: it is tighter job function targeting and exclusions set on day one.
Holdout accounts are a matched set of target accounts that receive no ABM treatment, used as a control group to measure incremental pipeline contribution. Without them, there is no baseline. But the more immediate problem is often list size.
Published ranges suggest common ABM lists run 500 to 2,000+ named accounts at companies that should operate lists of 100 to 300 (GrowthSpree [ABM26], June 2026, practitioner view, no stated sample). A list of 600 accounts with a team of two or three people means each account receives near-zero coordinated treatment.
Recommended account tier sizes (published ranges, no sample stated):
Recotap observed in 2025: "ABM is still measured at the campaign or lead level, not the account level where buying decisions actually happen" (Recotap, 2025).
Published buying committee sizes by deal size (GrowthSpree [BC26], published ranges, no sample stated):
| Deal Size | Stakeholders | Typical Sales Cycle |
|---|---|---|
| $25K to $100K | 5 to 8 | 49 to 84 days |
| $100K to $250K | 7 to 10 | 84 to 126 days |
| $250K to $1M | 10 to 15 | 126 to 180 days |
When a campaign reaches only one or two people at an account, and the deal requires seven to ten stakeholders to align, the dashboard records engagement. Sales records silence.
Account-based marketing (ABM) analytics metrics that predict pipeline are account-to-opportunity rate, pipeline per target account, buying-group coverage per account, and pipeline velocity. Pipeline velocity has replaced MQL volume as the primary executive metric in 71% of B2B marketing organizations (The Starr Conspiracy, 2025). Engagement scores and accounts reached are activity metrics and do not appear in a CFO's pipeline review.

As INFUSE noted in 2025: "Velocity increases often precede pipeline stage progression by two to four weeks, providing demand teams with early signals." That two-to-four week lead time is meaningful: a velocity increase at a target account signals active evaluation before a formal SQL is created.
Gartner's 2025 research, cited by Callbox, found that "content tailored narrowly to one individual had a 59% negative impact on group consensus." Single-contact campaign measurement fails precisely because buying decisions happen across a committee, not through one person.
Sourced versus influenced pipeline is a distinction that matters at the board level:
| Term | Definition | When to report it |
|---|---|---|
| Marketing-sourced pipeline | Pipeline from opportunities where marketing generated the first touch | Report when marketing runs outbound ABM sequences |
| Marketing-influenced pipeline | Pipeline where marketing touched at least one stakeholder before close | Report alongside sourced to show breadth of reach |
| Pipeline per target account | Total pipeline value divided by named accounts in the program | The primary ABM efficiency metric |
Both sourced and influenced pipeline are valid. Report sourced pipeline when marketing initiates outbound sequences. Report influenced pipeline when marketing supports active deals. Never present influenced pipeline as sourced: the CFO will spot the difference.
Published cost-per-SQL benchmarks for B2B SaaS vary by annual contract value (ACV) band: $1,000 to $3,000 for $15K to $50K ACV, $3,000 to $8,000 for $50K to $150K ACV, and $8,000 to $20,000 for contracts above $150K ACV (GrowthSpree [B26], April 2026, practitioner benchmark, no stated sample). B2B SaaS win rates fell to 19% in 2025, down from 29% in 2024, raising the pipeline coverage multiple required to hit quota.
GrowthSpree LinkedIn Audit, June 2026: Across 56 accounts with $9.4M in ad spend analyzed, LinkedIn clicks for B2B SaaS run $8 to $25 by vertical [L26]. Decision-makers received only 33% of that budget against a target of 60% or more. At $8 to $25 per click and the wrong people clicking, the gap between spend and SQL creation is arithmetic, not a strategy problem.
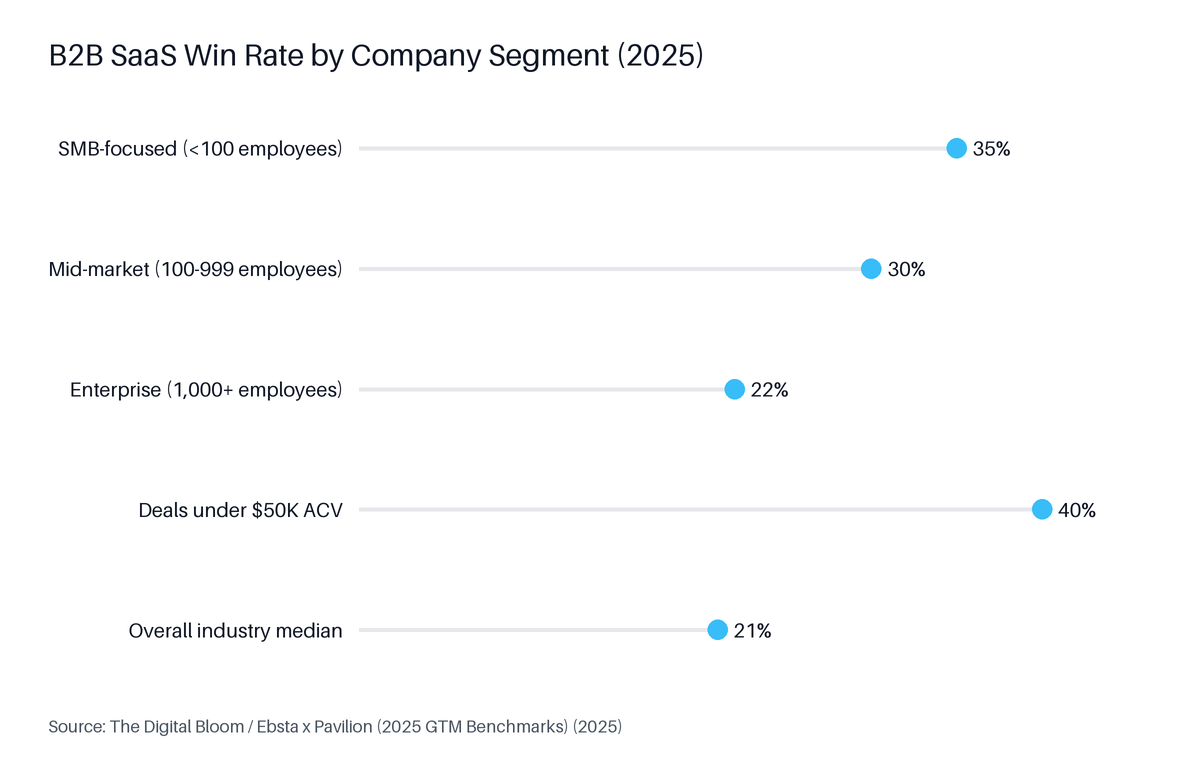
Source: The Digital Bloom / Ebsta × Pavilion (2025 GTM Benchmarks), 2025
Win rates in 2025 break down further by segment: SMB-focused companies averaged 35%, mid-market 30%, and enterprise 22%, while deals under $50K ACV reached 40% (Ebsta × Pavilion GTM Benchmarks 2025, cited by Zenitdata). A lower overall win rate means the same revenue target requires more qualified opportunities, which makes cost-per-SQL a board-level number.
| ACV Band | Target Cost per SQL | Recommended Channel Mix |
|---|---|---|
| $15K to $50K | $1,000 to $3,000 | Search plus LinkedIn, 1:many |
| $50K to $150K | $3,000 to $8,000 | Multi-channel ABM plus search |
| $150K+ | $8,000 to $20,000 | Full ABM, branded search, display |
Source: GrowthSpree [B26], April 2026; practitioner benchmark, no stated sample.
Run these three checks before adjusting budget:
Marketing analytics tools built for B2B SaaS pipeline measurement connect multi-touch account activity to CRM opportunity records, attributing pipeline across every buying-group member rather than to the last click before form submission. Only 52% of B2B marketing teams currently measure marketing cost per pipeline (Benchmarkit, 2025), a gap these tools are specifically designed to close. Standard web analytics record sessions at the visitor level and cannot stitch a multi-stakeholder deal.

For deals worth $100K to $250K, a single opportunity may involve 7 to 10 stakeholders across 84 to 126 days (GrowthSpree [BC26], published ranges, no sample stated). A session-based tool assigns credit to whichever page that single contact last visited before submitting a form. An account-level attribution tool traces every touch across all contacts at the account and joins them to the CRM opportunity.
The tools most commonly used for B2B SaaS pipeline attribution share a core capability: they resolve account-level traffic to a company, join it to CRM opportunity data, and assign multi-touch credit across the full buying journey.
| Tool | Primary strength | Best fit |
|---|---|---|
| Dreamdata | Full B2B revenue attribution, account journey timelines | Mid-market and enterprise SaaS |
| HockeyStack | Pipeline influence by channel, no-code setup | Series A to Series C SaaS |
| Factors.ai | Account identification plus attribution in one layer | Teams without a dedicated data engineer |
| Adobe Marketo Measure | Deep Salesforce integration, multi-touch models | Enterprise SaaS on Salesforce |
| Ruler Analytics | Call and form attribution joined to CRM | Revenue teams with offline conversions |
No pricing or feature claims are made for the tools above, as these details change. Verify against each vendor's own current documentation before selecting.
A CRM with opportunity stage tracking, a LinkedIn Company Engagement Report, and consistent UTM tagging covers the basics for teams at $15K to $50K ACV without a dedicated attribution tool. The limitation is that account-level multi-touch stitching requires manual work. That is a reasonable trade-off when team size or budget makes a dedicated tool premature.
Segmenting a B2B SaaS email list by account tier and buying group role requires two CRM fields on every contact: an account tier (T1, T2, or T3) and a buying group role (economic buyer, technical evaluator, champion, or procurement). Procurement is involved in 62% to 78% of US enterprise deals (GrowthSpree [BC26], published ranges, no sample stated), yet most campaigns never reach them. Filter email sequences on both fields simultaneously.

Assign each target account a tier field based on ideal customer profile (ICP) fit and deal-size potential:
In HubSpot, this is a custom company property. In Salesforce, it is a custom field on the Account object. The tier value flows to all associated contacts through a standard lookup.
Every contact at a target account needs a role field:
Procurement is involved in 62% to 78% of US enterprise deals and 85% to 94% of Indian enterprise deals (GrowthSpree [BC26], published ranges, no sample stated). With those rates, reaching only the economic buyer and champion creates a predictable late-stage gap when procurement enters the deal.
An email sequence sent to "all contacts at target accounts" treats a T1 economic buyer and a T3 procurement contact identically. The correct filter is: Tier = T1 AND Role = Economic Buyer. That combination drives the subject line, content format, send frequency, and the threshold for routing to a sales development representative (SDR).
A practical segmentation matrix:
| Account Tier | Economic Buyer | Technical Evaluator | Champion | Procurement |
|---|---|---|---|---|
| T1 (1:1) | Bespoke sequence, 6 to 8 touches | Technical deep-dive, 4 to 6 touches | Win-together content, 6 touches | Compliance pack at stage 3+ |
| T2 (1:few) | Cluster case study, 4 to 6 touches | Integration brief, 3 to 4 touches | Cluster peer story, 4 touches | Standard vendor pack |
| T3 (1:many) | Programmatic sequence, 3 to 4 touches | Self-serve content offer | Awareness content | On request |
Account-level pipeline analytics and account-based marketing (ABM) segmentation are not the right fit when annual contract value (ACV) is below $15K, when there is no sales team working named accounts, or when the total addressable market (TAM) is too broad to define a manageable named-account list. Below $15K ACV, the cost of reaching multiple stakeholders per account typically exceeds the return, per GrowthSpree's April 2026 benchmarks (TwoSpouts / GrowthSpree, 2026).
Additional situations where this framework does not apply:
The honest limit of any published benchmark: ranges for cost-per-SQL and buying committee size from GrowthSpree's published sources carry no stated sample or methodology. They are directional references. Treat them as a starting point for internal targets, then measure against your own account cohort after one full sales cycle.
Account-based marketing analytics should measure account-to-opportunity rate and pipeline per target account, not engagement scores or accounts reached. Engagement is an activity metric: it records that an account visited a page or opened an email, not that a buying group member signaled purchase intent. The outcome metric is whether an account moved to a sales-qualified opportunity within a defined period.
ABM software options for B2B SaaS teams vary by deal size, data needs, and team capacity. The right choice depends on whether your ACV and pipeline volume justify a dedicated platform versus running account-based marketing with LinkedIn and a CRM. A full side-by-side comparison, including the no-platform option, is covered in the ABM platforms comparison guide on this site.
Marketing analytics tools purpose-built for B2B SaaS pipeline measurement include Dreamdata, HockeyStack, Factors.ai, Adobe Marketo Measure, and Ruler Analytics. Each connects multi-touch account activity to CRM opportunity data, enabling account-to-opportunity attribution rather than lead-level last-touch credit. The right tool depends on your CRM, deal complexity, and whether you need account-level or buying-group-level reporting.
Published benchmarks for cost per sales-qualified lead (SQL) in B2B SaaS range from $1,000 to $3,000 for $15K to $50K annual contract value (ACV) contracts, $3,000 to $8,000 for $50K to $150K ACV, and $8,000 to $20,000 for $150K+ ACV contracts (GrowthSpree [B26], April 2026). Win rates averaged 19% across B2B SaaS in 2025, down from 29% in 2024 (Ebsta × Pavilion GTM Benchmarks 2025).
Segment a B2B SaaS email list by first assigning each contact record an account tier field (T1, T2, or T3) in your CRM, then adding a buying group role field (economic buyer, technical evaluator, champion, or procurement). Email sequences are then filtered by both fields simultaneously, so a T1 economic buyer receives different messaging and frequency than a T2 technical evaluator at a cluster account.
The core problem behind 600 engaged accounts and zero SQLs is almost always structural. The analytics layer measures reach. The account list is too large for the team. The campaign reaches one or two people at deals that require seven to ten stakeholders to align.
Fixing it requires three changes. First, replace engagement metrics with account-to-opportunity rate and pipeline per target account as the primary reporting outputs. Second, size the account list to what the team can actually cover: 10 to 50 accounts at T1, 50 to 200 at T2, 200 to 500 at T3. Third, add buying group role as a CRM field on every contact and segment email by both tier and role simultaneously.
Cost-per-SQL benchmarks give a target to compare against: $1,000 to $3,000 at $15K to $50K ACV, $3,000 to $8,000 at $50K to $150K ACV, and $8,000 to $20,000 above $150K ACV. With B2B SaaS win rates at 19% in 2025, the math on pipeline coverage is unforgiving. Measure the right things and the program becomes defensible.
Meet with an expert. A free consultation. Bring your target account list and brainstorm the next step with an ABM expert. Meet with an expert