Blog
ABM Platform and Software Comparison: What to Evaluate Before You Sign
Which ABM software shows pipeline, not just engagement scores? Evaluation criteria, the no-platform option, POC scorecard, and renewal contract terms.
Firmographic data defines your ICP by company size, industry, revenue and headcount. Learn how B2B SaaS teams use it to build ABM lists of 100-300 accounts.

Request a quote and our experts will contact you within 24 hours with tailored solutions and pricing.
abmforb2bsaas.com
Last updated: Oct 14, 2026
Firmographic data is structured descriptive information about a company - its industry, employee headcount, annual revenue, geography, and growth stage - and it is the first filter B2B SaaS teams apply when building a target account list for account-based marketing (ABM).
Most ABM programs fail before a single ad runs. The problem is not the channel or the creative. The problem is the list. A team of three cannot meaningfully work 1,500 named accounts. Firmographic filters are the tool that separates the eligible universe from the workable set. Get them right and the rest of the program has somewhere to land.
This guide covers what firmographic data is, which attributes matter for ideal customer profile (ICP) definition, how to build and tier a target account list, where firmographic fit ends and intent data begins, and the limits of firmographic targeting that most guides skip.
Key Takeaways
- Firmographic data describes a company by industry, headcount, revenue, geography, and growth stage - the five attributes that define ICP eligibility in B2B SaaS.
- Firmographic filters are the first gate in ABM list-building. Without them, total addressable market (TAM) analysis produces a list no small team can sustain.
- GrowthSpree's June 2026 analysis found common ABM lists run 500 to 2,000+ named accounts at companies that should be working 100 to 300 (published ranges, no sample stated).
- Firmographic fit identifies eligible companies but not in-market ones. Intent signals are required to prioritize accounts actively researching a purchase.
- Without contact-level filters layered on top of firmographic targeting, ads reach non-buyers. GrowthSpree's June 2026 audit of 56 LinkedIn accounts found decision-makers received only 33% of budget, against a target of 60% or more.
ABM for B2B SaaS Editorial Team. Last updated: 13 October 2026. All figures in this article are drawn from named GrowthSpree studies cited as the source of record. No figure is presented as a study finding unless the underlying report names it. Published ranges without a stated sample are labeled as such.
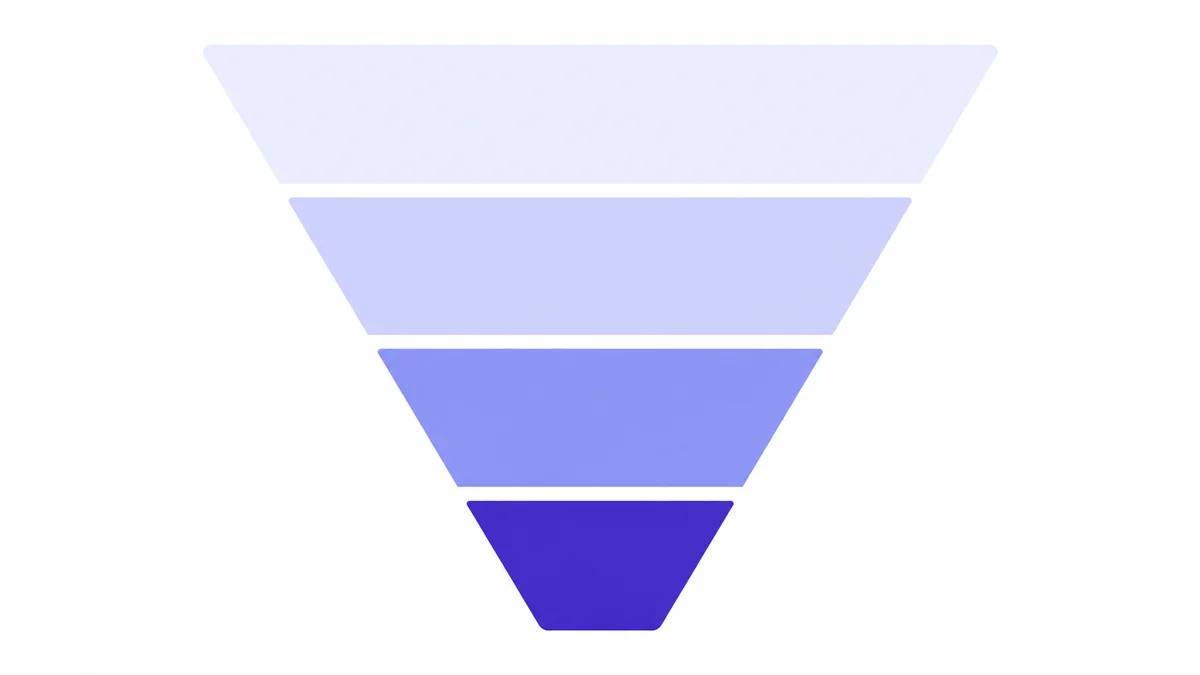
Firmographic data is structured descriptive information about a company - its industry classification, employee headcount, annual revenue, geography, legal structure, and growth stage - used to classify and filter companies in B2B marketing. B2B SaaS teams use firmographic data to define the ideal customer profile (ICP) and to filter a broad total addressable market (TAM) down to the named accounts most likely to close, before any campaign or outreach begins.
The term is an analogy to demographic data in consumer marketing. Where demographics describe a person's age, location, and household income, firmographics describe the equivalent attributes of an organization. Both types of data serve the same function: they set the boundary of who the team is trying to reach before deciding what to say or where to say it.
In B2B SaaS, firmographic data typically comes from providers that aggregate company records from public filings, job postings, web crawls, and direct company disclosures. Industry classification is usually expressed as a NAICS code, maintained by the U.S. Census Bureau, or as a SIC code, maintained by the U.S. Securities and Exchange Commission. Both systems give teams a standardized vocabulary for filtering by sector. The key firmographic attributes for most B2B SaaS ICP definitions are:
Technographic data is information about the software tools and technology stack a company uses. Technographics add a compatibility layer to ICP filtering, but firmographics come first. A company must fit the firmographic profile before its tech stack becomes relevant.
The firmographic attributes that matter most for B2B SaaS ideal customer profile (ICP) definition are industry vertical, employee headcount band, estimated annual revenue, geography, and company growth stage. These five filters separate companies that can buy from the much larger universe that technically exists. Each filter removes a category of accounts the team would otherwise pursue and eventually abandon.
The table below shows how each attribute connects to a specific ICP decision in B2B SaaS:
| Firmographic Attribute | What It Filters | ICP Decision It Supports |
|---|---|---|
| Industry vertical | Sector relevance | Does the problem the product solves exist in this industry? |
| Employee headcount | Org size and complexity | Is the company large enough to have the budget and buying process? |
| Annual revenue | Budget capacity | Can the company afford the ACV at standard pricing? |
| Geography | Region and regulatory context | Does the product operate in this market, and how does the buying process differ? |
| Growth stage | Urgency and buying maturity | Is the company in a phase where this category of spend is a priority? |
Industry vertical is the most commonly misapplied firmographic filter in B2B SaaS. Teams often start with broad categories - "technology companies," "financial services" - that are too wide to be useful. The more precise filter is the specific sub-vertical where the product has actually won deals: "Series B FinTech companies processing payments" rather than "financial services."
The vertical also sets the context for buying group composition and procurement norms. Industry shapes who is in the room when a contract is signed. That matters for designing outreach across the full buying committee.
Headcount and revenue work together. Headcount is easier to source from data providers because it is often visible through job postings and LinkedIn profiles. Revenue is frequently estimated or modeled, especially for private companies.
For B2B SaaS, headcount bands translate directly into deal complexity. A 50-person company and a 500-person company in the same vertical will have very different buying processes, stakeholder counts, and procurement involvement. GrowthSpree's 2026 buying committee benchmarks (BC26, published ranges, no sample stated) show that deals in the $25K-$100K annual contract value (ACV) range involve 5 to 8 stakeholders, while $100K-$250K deals involve 7 to 10. Headcount is the fastest proxy for which band an account falls into.
Geography matters for two reasons: product availability and buying process. An account in the United States and a structurally identical account in India will have different procurement involvement and different approval chains. GrowthSpree's 2026 buying committee benchmarks (BC26, published ranges, no sample stated) show procurement is involved in 62% to 78% of US enterprise deals and 85% to 94% of Indian enterprise deals. A firmographic filter that ignores geography mixes accounts that need very different outreach approaches.
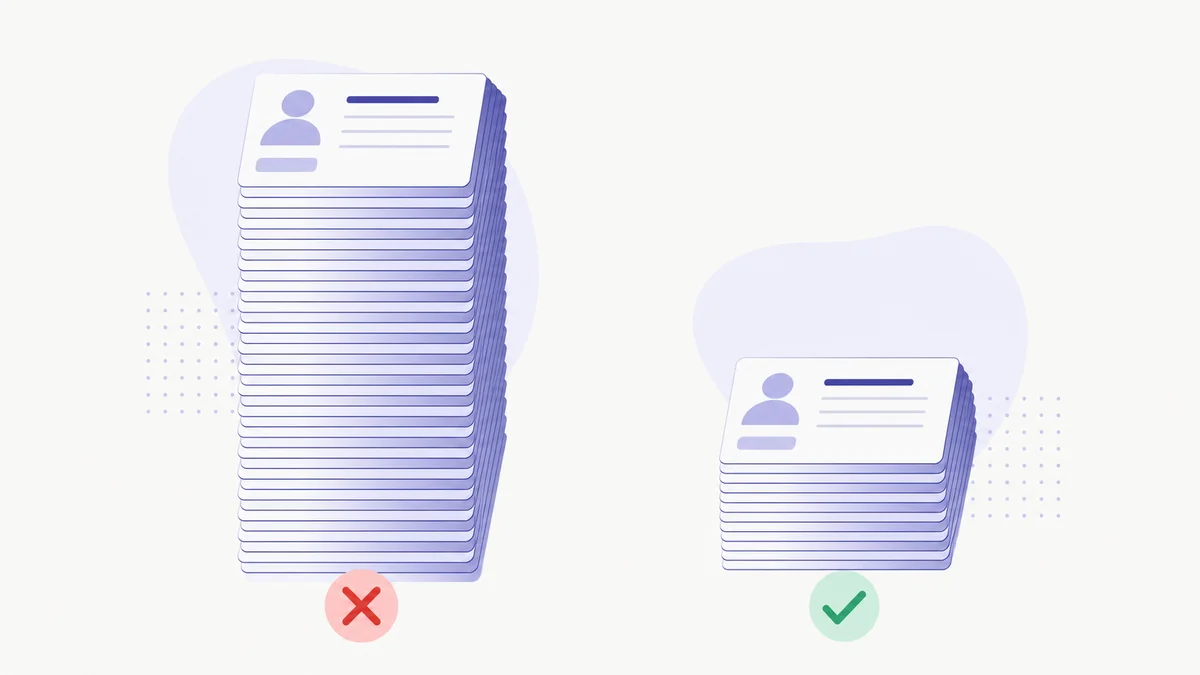
Firmographic filters are the first gate in account-based marketing (ABM) list-building because they establish eligibility before any other signal is evaluated. Without them, a total addressable market (TAM) of tens of thousands of companies produces a target account list no small team can sustain. GrowthSpree's June 2026 analysis found that common ABM lists run 500 to 2,000+ named accounts at companies that should be working 100 to 300 (ABM26, published ranges, no sample stated).

The cost of a bloated list is not theoretical. LinkedIn advertising for B2B SaaS runs $8 to $25 per click by vertical (GrowthSpree, June 2026). Every account that should not be on the list consumes that budget without a realistic path to closing.
GrowthSpree (June 2026): In 56 LinkedIn accounts audited across $9.4M in ad spend, 20% of spend reached firms under 50 employees - companies outside most B2B SaaS ICPs by headcount. That is one dollar in five spent on companies that, in most cases, would never close at the deal sizes those programs were built to support.
Oversized lists persist for a structural reason. Teams start with TAM analysis and export everything that loosely matches the product category. The export becomes the target account list because no stricter filter was applied before passing it to sales and marketing. Firmographic filters are the mechanism for applying that stricter filter.
The sequence matters. Firmographic filters run first because they are:
Intent signals, fit scores, and technographic overlays come after the firmographic filter, not before. Applying intent data to an unfiltered TAM identifies which irrelevant companies are searching. Applying intent data to a firmographically filtered set of 300 accounts identifies which of those 300 are in a buying motion right now. That is actionable.
Turning firmographic filters into a sized, tiered target account list for account-based marketing (ABM) starts with validating the ideal customer profile (ICP) against historical closed-won data, then applying each firmographic filter in sequence to reduce the total addressable market to a workable set. The result is sorted into three tiers-1:1, 1:few, and 1:many - sized to the team's capacity, not to the size of the market.
Before applying any filter, pull the last 12 to 24 months of closed-won deals and look at the firmographic attributes of the companies that actually signed. Not the companies that entered the pipeline - the ones that closed.
The goal is to identify which headcount bands, verticals, geographies, and revenue ranges are over-represented in won deals relative to the overall pipeline. Those over-represented attributes become the starting point for the ICP definition. Applying filters that reflect the market as imagined, rather than the market as proven, is how ABM lists grow to 1,500 accounts.
Once the ICP attributes are validated, apply them as sequential filters:
Each filter should reduce the list. If one filter removes fewer than 10% of accounts, it may be too broad to be useful.
The filtered list is sized to the team's actual capacity, then divided into tiers. GrowthSpree's June 2026 analysis (ABM26, published ranges, no sample stated) provides the following tier sizing:
| Tier | ABM Type | Account Count | Treatment |
|---|---|---|---|
| Tier 1 | 1:1 | 10 to 50 accounts | Bespoke content and outreach per account |
| Tier 2 | 1:few | 50 to 200 accounts, in 5-15 clusters | Content and outreach per cluster |
| Tier 3 | 1:many | 200 to 500 accounts | Programmatic tactics across the full list |
A team of three running a 1:1 program for 200 accounts is not running ABM - they are running a contact list. Most companies with a small team should target 100 to 300 total accounts across all tiers.
After tiering, apply a simple fit score to the accounts within each tier. Fit scoring at this stage ranks firmographic closeness to the ICP. Common inputs are:
The highest-fit accounts within each tier move to the top of the outreach sequence.
Firmographic data connects directly to buying group size because company size and deal value determine how many stakeholders are involved in a purchase. GrowthSpree's 2026 buying committee benchmarks show that deals in the $25K-$100K annual contract value (ACV) range involve 5 to 8 stakeholders with 49 to 84 day sales cycles, while $250K-$1M deals involve 10 to 15 stakeholders with cycles of 126 to 180 days (BC26, published ranges, no sample stated).
This connection shapes how the ABM program is designed, not just which accounts are on the list. A target account in a headcount band that typically produces $250K deals needs outreach designed for 10 to 15 stakeholders across a six-month window. A target account producing $50K deals needs outreach for 5 to 8 stakeholders across roughly two months. The firmographic filter determines which design applies.
GrowthSpree (BC26, 2026): Procurement is present in 62% to 78% of US enterprise deals and 85% to 94% of Indian enterprise deals (published ranges, no sample stated). Knowing the headcount band and geography of a target account tells the team whether to plan for procurement from the first touch - not as a late-stage surprise.
The cost per sales-qualified lead (SQL) benchmarks reflect this complexity directly. GrowthSpree's April 2026 SaaS Google Ads Benchmarks (B26, published ranges, no sample stated) provide the following ranges:
| Annual Contract Value (ACV) Band | Target Cost per SQL |
|---|---|
| $15K to $50K | $1,000 to $3,000 |
| $50K to $150K | $3,000 to $8,000 |
| $150K and above | $8,000 to $20,000 |
The ACV band of a target account - closely predicted by its firmographic profile - determines the cost structure the program must operate within. A campaign aimed at enterprise accounts that produces sales-qualified leads (SQLs) at $1,500 each is either reaching accounts that are too small, or closing accounts that will churn. Firmographic filtering prevents both problems.
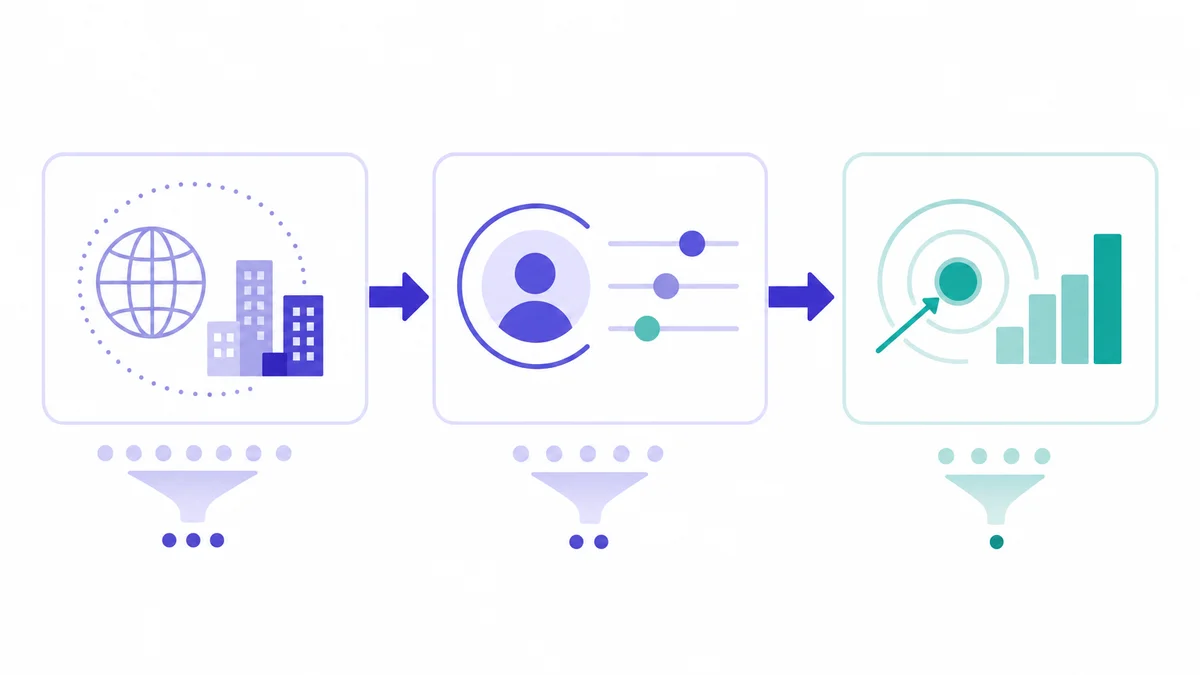
Intent data is behavioral information - topic searches, review-site visits, content downloads - that signals a company may be actively researching a purchase in a given category. Firmographic data identifies which companies are eligible to buy; intent data identifies which eligible companies are in a buying motion right now. The two are sequential: apply firmographic filters first, then layer intent signals on the resulting shortlist.
Intent data is gathered through three main mechanisms:
Each signal type carries different reliability. Review-site visits during an active evaluation window are a strong signal. A single content download is weaker. The combination of multiple signals from a firmographically qualified account is more actionable than any one signal in isolation.
A company that fits every firmographic criterion may not be in market for another 18 months. Intent signals fill that gap by surfacing accounts already in a buying motion. The relationship is a sequence, not a substitution:
Skipping step one and applying intent data to an unfiltered TAM is a common and expensive mistake. It surfaces companies that are searching for a solution - but many will be outside the ICP by headcount, vertical, or geography. The intent signal is real; the account is not a fit.
Intent data also requires a named action to be useful. Signals are most valuable when each one is tied to a specific response and an owner. Weekly intent reports sent to sales with no assigned follow-up consistently go unused. The firmographic filter ensures that when an intent signal fires, the account has already passed the eligibility screen. The sales team's response is spent on accounts that can close.
Firmographic targeting identifies eligible companies but not the right individuals within them, and it cannot distinguish in-market accounts from dormant ones. Without contact-level filters on seniority and job function, firmographic lists deliver budget to non-buyers. GrowthSpree's June 2026 audit of 56 LinkedIn accounts across $9.4M in ad spend found that 20% of that spend reached firms under 50 employees - outside most B2B SaaS ICPs entirely.
The contact-level problem is distinct from the company-level problem. A target account list built from firmographic filters identifies the right companies. What happens next - which people inside those companies receive ads, calls, and emails - is determined by contact-level targeting, not by firmographic data.
GrowthSpree (June 2026): Across 56 audited LinkedIn accounts: decision-makers received only 33% of ad budget against a target of 60% or more; non-buying job functions caused 30% of wasted spend; individual contributors and entry-level staff consumed 36% of budget. The companies on the list were correct. The people being reached were not.
Firmographic targeting alone does not solve this. Contact-level filters on job function, seniority, and department must be applied at the campaign level - in LinkedIn's company targeting settings, for example - after the account list is set.
| Limitation | What It Means in Practice | What Closes the Gap |
|---|---|---|
| No in-market signal | A firmographic fit does not mean active buying intent | Intent data layered on top |
| No contact-level precision | Company filters do not filter to the right individuals | Job function and seniority exclusions |
| Headcount as revenue proxy | Headcount is often estimated, not verified revenue | Cross-reference multiple data sources |
| Data staleness | Firmographic data can lag company changes by months | Quarterly refresh on headcount and stage |
| Broad filters produce bloated lists | Wide parameters create unworkable account volumes | Tighten each filter against closed-won data |
Firmographic filtering at this level of precision is a tool for teams selling to named accounts with annual contract values above $15K and at least one seller working the list. Below that price point, the cost of researching, filtering, and maintaining a firmographic ICP usually exceeds the marginal revenue per account. Self-serve SaaS products with no sales motion and low ACVs do not benefit from this level of ICP work. The effort scales with the deal.
Firmographic data is structured descriptive information about a company - its industry, employee headcount, annual revenue, geography, legal structure, and growth stage. B2B SaaS teams use firmographic data to define the ideal customer profile (ICP) and filter a broad total addressable market down to the named accounts most likely to buy, before any campaign runs.
Firmographic data describes what a company is - its size, industry, revenue, and location. Technographic data describes what tools and software a company uses. In account-based marketing, firmographics set the eligibility boundary and technographics add a compatibility layer: a target account must fit the firmographic profile before its tech stack becomes relevant.
Published ranges suggest 10 to 50 accounts for 1:1 treatment, 50 to 200 accounts grouped into 5 to 15 clusters for 1:few, and 200 to 500 for 1:many. Most small teams should operate lists of 100 to 300. Lists of 500 to 2,000+ accounts are common but typically exceed what a small team can sustain (GrowthSpree, June 2026, published ranges, no sample stated).
1:1 ABM dedicates bespoke content and outreach to each individual account, reserved for the highest-value targets. 1:few groups accounts with shared characteristics into clusters of 5 to 15 and creates content for each cluster. 1:many applies programmatic tactics across a broader named-account list of 200 to 500 accounts.
Firmographic filters are a necessary first step but not sufficient on their own. They eliminate companies that cannot buy, but they do not identify which eligible companies are actively researching a purchase. Combining firmographic fit with intent signals and historical win data produces a list sized and prioritized for the team that will work it.
No. Firmographic data identifies which companies belong on the list. Reaching the right individuals within those companies requires contact-level data: job title, seniority, department, and function. Without those filters, ads and outreach reach non-buyers. In 56 audited LinkedIn accounts, individual contributors and entry-level staff consumed 36% of budget (GrowthSpree, June 2026).
Firmographic targeting produces lists too large to work when the filters are too broad - for example, all software companies with 200 or more employees in North America. It also fails when the ICP has not been validated against closed-won deals. Filters should reflect accounts that have actually bought, not hypothetical fits.
Firmographic data is where ICP definition starts: industry, headcount, revenue, geography, and growth stage are the five filters that separate eligible accounts from the rest of the market. Applied before any campaign runs, they reduce a TAM of thousands to a target account list a real team can work.
Five things to carry forward:
The next step is sizing the program to the team and structuring the tiers so each account receives treatment it can sustain.
A free consultation. Bring your target account list and brainstorm the next step with an ABM expert.
Meet with an expert
All figures in this article draw from four GrowthSpree studies published between April and June 2026, each cited inline with its source code and caveat. No third-party statistics were available in the verified research packet for this topic. Ranges from BC26 and ABM26 carry no stated sample and are labeled as published ranges throughout. See the editorial methodology for the full sourcing standard applied to every figure on this site.
ABM for B2B SaaS Editorial Team. Last updated: 13 October 2026. The independent ABM hub for B2B SaaS.