Blog
Attribution Models for B2B SaaS: What Each Measures and Where It Fails
Attribution models compared by deal size, sales cycle and buying group. What first-touch, last-touch, U-shaped and W-shaped each measure and where they fail.
Published ranges for splitting B2B SaaS marketing budget across ABM, demand generation, and brand, with sources, sample status, and a tier-first method.
 Ishan ManchandaNov 6, 2026
Attribution models compared by deal size, sales cycle and buying group. What first-touch, last-touch, U-shaped and W-shaped each measure and where they fail.

Cut an oversized target account list to team capacity: fit and intent scoring, tier sizes, TAM limits, template fields and post-quarter refinement.
Published B2B SaaS sales conversion rates by ACV band: win rates from 12% to 35%, stage-by-stage funnel benchmarks, and how to project pipeline.
Request a quote and our experts will contact you within 24 hours with tailored solutions and pricing.
Last updated: Nov 6, 2026
By the ABM for B2B SaaS Editorial Team. Last updated October 28, 2026. Method: every figure names its source and year, and ranges without a stated sample are labeled as published ranges.
Marketing budget allocation for a B2B SaaS company means dividing spend across account-based marketing (ABM), demand generation, and brand, and it works best when target account tiers are defined before any percentages are set. After a funding round, the board sets an enterprise pipeline target, and the argument over the split begins. Benchmarkit reports current B2B budgets at 70% demand generation and 25% brand in its 2025 survey, with no ABM line at all. This page lays out the published ranges, labels their sample status, and shows why decision order matters more than percentages. It also keeps ABM separate from demand generation scope.
Key Takeaways
- Marketing budget allocation for B2B SaaS should start with a total envelope and account tiers, then split spend across ABM, demand generation, and brand.
- Benchmarkit's 2025 survey reports current B2B budgets at 70% demand generation and 25% brand, but the page shows no sample size.
- The median private B2B SaaS company spends 8% of annual recurring revenue on marketing (SaaS Capital, 2026).
- No ABM share of budget with a stated sample was found, so any ABM percentage is a working assumption, not a standard.
- A board pipeline target should be converted into opportunities and cost per sales-qualified lead (SQL) before spend is split.
A B2B SaaS company should set the total envelope first, then split it across ABM, demand generation, and brand using account tiers, annual contract value (ACV), and team size. No ABM share with a stated sample was found. The closest published split is Benchmarkit's 2025 survey: 70% demand generation and 25% brand, with no ABM line.

Marketing budget allocation is the process of dividing a fixed marketing spend across channels and goals. For B2B SaaS, the three buckets in dispute are ABM, demand generation, and brand. Expansion marketing for existing customers is a fourth bucket that often gets skipped.
The table shows the figures that exist, with their sample status. Read the last column before quoting any of them.
| Question | Published figure | Source and year | Sample status |
|---|---|---|---|
| Current brand vs demand split | 70% demand generation, 25% brand | Benchmarkit (2025) | Survey; sample size not shown |
| Preferred brand vs demand split | 50% demand, 40% brand | Benchmarkit (2025) | Self-reported preference; sample not shown |
| Marketing share of sales and marketing budget at ACV $25K to $100K | 35% to 37% (median) | Benchmarkit (2025) | Medians by ACV segment; sample not shown |
| Marketing spend as share of ARR | 8% (median) | SaaS Capital (2026) | Private B2B SaaS annual survey |
| ABM share of marketing budget | No figure with a stated sample found | None |
Published splits are mostly two-way, brand against demand. ABM sits inside one of those buckets or inside sales cost. That is why the next sections fix the envelope and the account tiers before choosing any percentage.
Total marketing spend for private B2B SaaS companies has a median of 8% of annual recurring revenue (ARR), unchanged from the prior year (SaaS Capital, 2026). Median selling costs run higher at 15% of ARR, up from 13%. Equity-backed private SaaS companies spend a median 101% of ARR across all departments, versus 96% for bootstrapped companies (SaaS Capital, 2026).
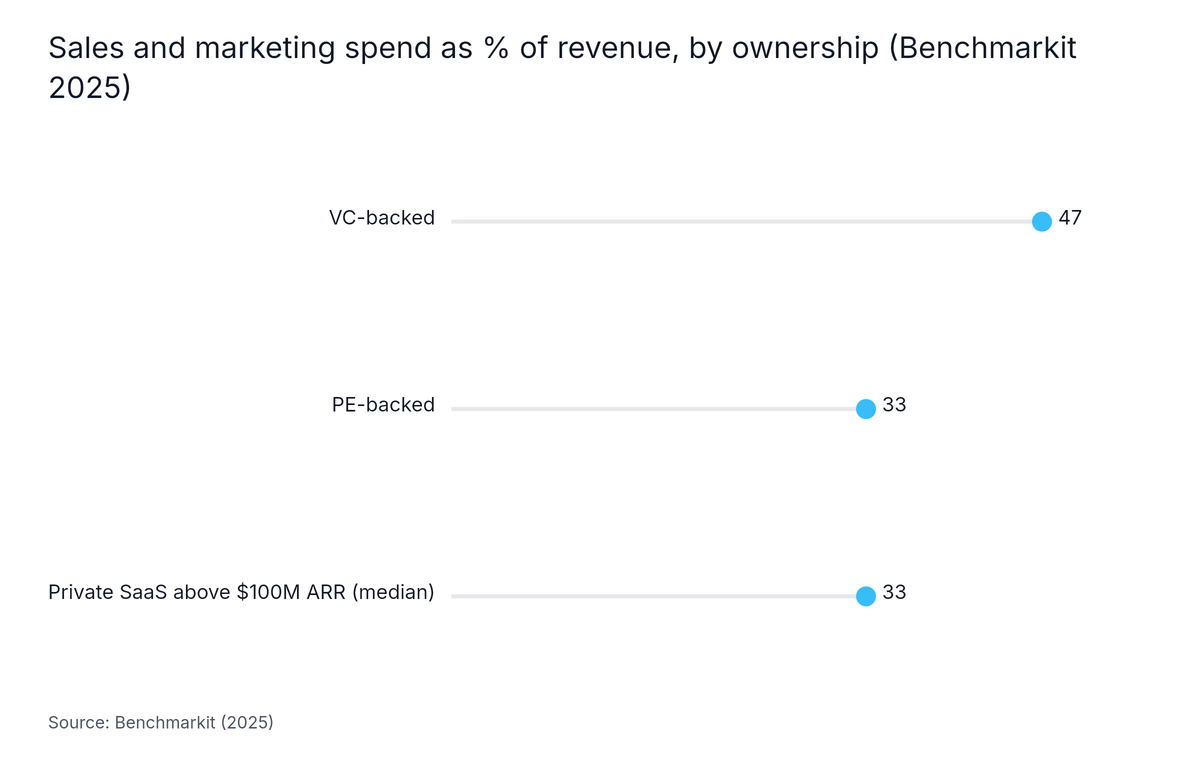
Source: Benchmarkit, 2025
SaaS Capital states it plainly: "The median percent of annual recurring revenue spent on marketing is 8%, unchanged from the previous year." (SaaS Capital, 2026) The 15% selling cost matters here. When ABM spend sits in a shared sales and marketing line, it may be counted on the sales side.
Ownership changes the envelope too. Sales and marketing spend is 47% of revenue for VC-backed SaaS companies versus 33% for PE-backed companies, and private companies above $100M ARR invest a median 33% (Benchmarkit, 2025, n=583).
Benchmarks use different denominators and populations. Pick the one that matches your company.
| Benchmark | Figure | Population | Denominator |
|---|---|---|---|
| SaaS Capital (2026) | 8% (median) | Private B2B SaaS | ARR |
| Gartner CMO Spend Survey (2026) | 7.8% (flat) | Marketing leaders, reported as mostly large firms | Revenue |
| Benchmarkit (2025) | 14% below $5M revenue, 4% above $150M | B2B SaaS by revenue band | Revenue |
| Benchmarkit (2025) | 47% VC-backed, 33% PE-backed | B2B SaaS, sales and marketing combined | Revenue |
Gartner's 2026 CMO Spend Survey found budgets flat at 7.8% of revenue, with 15.3% of budgets going to AI (Gartner, 2026). The prior-year survey reported 7.7% (Business Wire, 2025).
A secondary report says the 2026 survey covered 401 senior marketers at businesses with more than $1 billion in revenue (Sword and the Script, 2026).
Verify that population detail with Gartner before relying on it. Businesses of that size are far larger than a typical post-round SaaS company, so SaaS Capital's private-company figure is the closer anchor.
Net out AI and martech before splitting channels. A tools line that is not set aside first will quietly shrink every bucket.
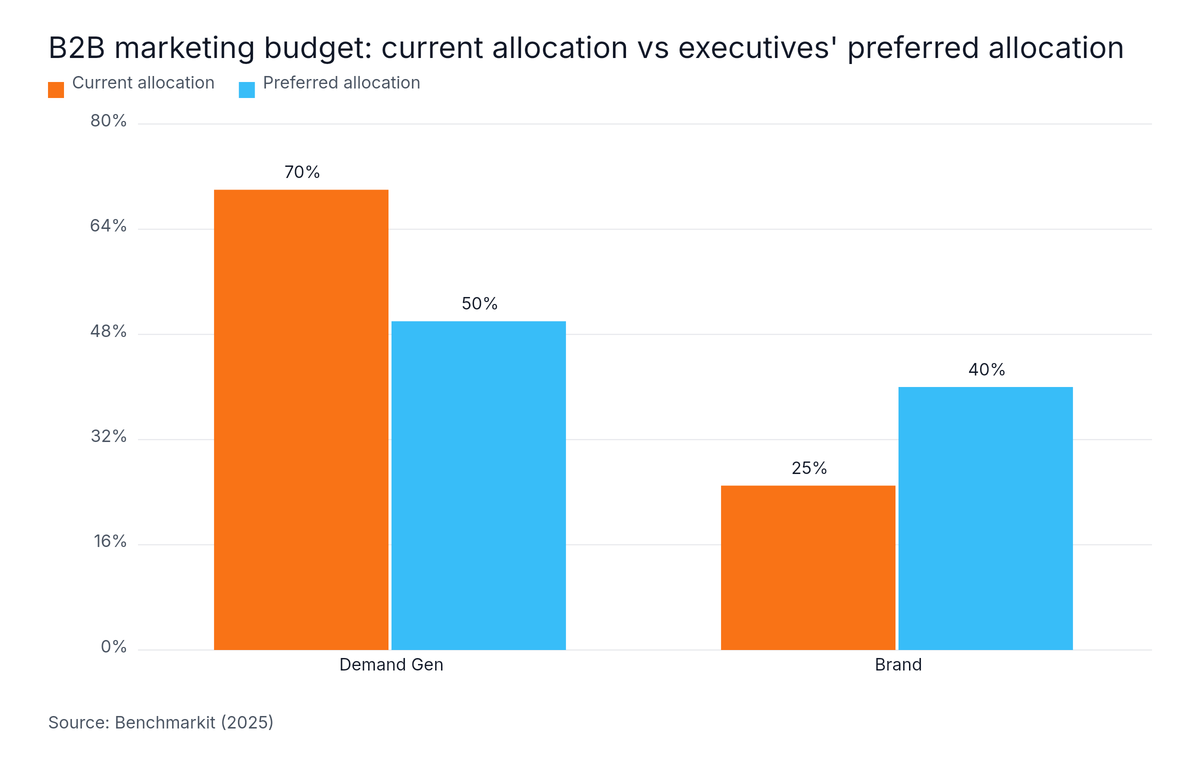
Benchmarkit's 2025 brand vs demand survey found current B2B budgets at 70% demand generation and 25% brand, while marketing executives said they would prefer 50% demand and 40% brand (Benchmarkit, 2025). The page shows no sample size, so these are survey figures, not an industry standard. Demand generation is spend that captures near-term pipeline; brand marketing is spend that builds recall before buyers enter a purchase.
Source: Benchmarkit, 2025
The gap between practice and preference is large. In Benchmarkit's words, "Marketing executives would prefer to allocate 50% of Marketing budget to Demand and 40% to Brand" (Benchmarkit, 2025). Preference is self-reported, so it shows intent, not results.
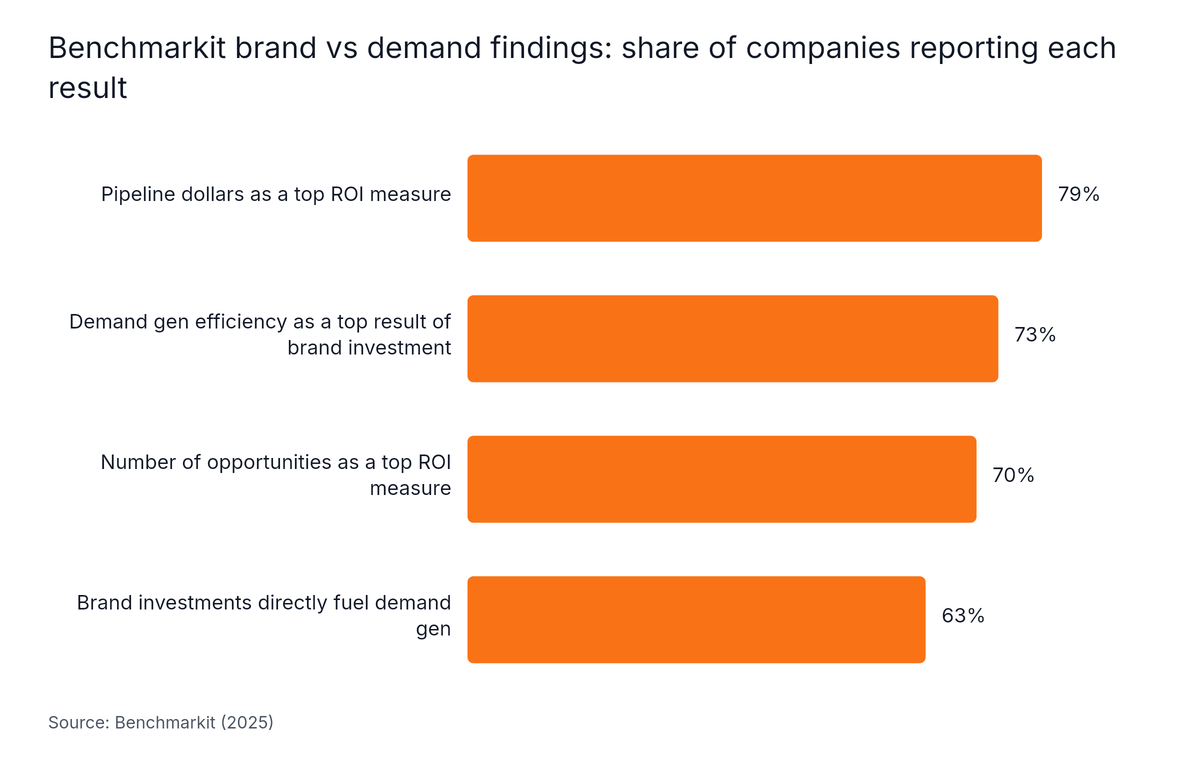
Respondents say it does. In the same survey, 73% of companies report that demand generation efficiency is a top result of brand investments, and 63% report that brand investments directly fuel demand generation (Benchmarkit, 2025). Pipeline dollars (79%) and number of opportunities (70%) are the top two ROI measures (Benchmarkit, 2025).
Source: Benchmarkit, 2025
These are survey responses, not controlled tests. They support giving brand a defined line, but they do not set its size.
Only 10% of marketing budget is allocated to expansion ARR, while 40% of growth comes from existing customers (Benchmarkit, 2025). That puts expansion in direct competition with new-logo ABM for the same dollars. Decide on purpose whether it gets a line.
Target account tiers should be defined before budget is allocated because the number of accounts in each tier, and the treatment each tier can sustain, sets the ABM line. Published ranges recommend 10 to 50 accounts for 1:1, 50 to 200 in 5 to 15 clusters for 1:few, and 200 to 500 for 1:many (GrowthSpree, 2026; practitioner view, no stated sample).

An account tier is a group of target accounts that receive the same level of ABM treatment. Setting a percentage first reverses the logic: the percentage guesses at a cost that the tiers would have calculated. The brand vs demand split from Benchmarkit (70% demand generation, 25% brand, 2025) shows the problem, since it has no tier or per-account cost anywhere in it.
| Tier | Published account range | Treatment | What sets the budget |
|---|---|---|---|
| 1:1 | 10 to 50 accounts | Bespoke content and outreach per account | Accounts times cost of custom work per account |
| 1:few | 50 to 200 accounts in 5 to 15 clusters | Content built for each cluster | Clusters times cost per cluster |
| 1:many | 200 to 500 accounts | Programmatic tactics across the list | Media and automation cost across the list |
The article "Most B2B SaaS ABM Programs Are Spray-and-Pray With Lipstick" (GrowthSpree, June 2026; practitioner view, no stated sample) says common lists run 500 to 2,000+ named accounts at companies that should run 100 to 300. A list that size cannot be funded tier by tier. It becomes one campaign for everyone, which is ordinary paid media with a new name. Building the list from fit criteria is the job of the firmographic data guide.
Untiered budgets leak toward the wrong people at the right companies. A study of 56 LinkedIn accounts shows the pattern.
What we found: In "The State of Wasted LinkedIn Ads Spend in B2B SaaS" (GrowthSpree, June 2026), covering 56 LinkedIn accounts and $9.4M in ad spend, decision-makers received 33% of budget against a target of 60% or more. Individual contributors and entry-level staff took 36% of budget, non-buying job functions caused 30% of wasted spend, and 20% of spend reached firms under 50 employees.
The accounts were right. The people and the mix were wrong.
The marketing budget split for a B2B SaaS company should change by deal size and team size. Benchmarkit's 2025 data puts marketing's share of total sales and marketing budget at 35% to 37% for annual contract value (ACV) of $25K to $100K, with enterprise motions tilting toward sales (Benchmarkit, 2025). No published split combines ACV band with team size.

Larger deals cost more to win and involve more people. The ranges below come from two 2026 publications by GrowthSpree: a Google Ads benchmark report and a buying committee size report (published ranges, no stated sample). They use different ACV bands, so read each row on its own.
| Publication | ACV band | Published range |
|---|---|---|
| Google Ads benchmarks (GrowthSpree, 2026) | $15K to $50K | Target cost per SQL of $1,000 to $3,000 |
| Google Ads benchmarks (GrowthSpree, 2026) | $50K to $150K | Target cost per SQL of $3,000 to $8,000 |
| Google Ads benchmarks (GrowthSpree, 2026) | $150K and above | Target cost per SQL of $8,000 to $20,000 |
| Buying committee benchmarks (GrowthSpree, 2026) | $25K to $100K | 5 to 8 stakeholders, 49 to 84 day sales cycles |
| Buying committee benchmarks (GrowthSpree, 2026) | $100K to $250K | 7 to 10 stakeholders, 84 to 126 day sales cycles |
| Buying committee benchmarks (GrowthSpree, 2026) | $250K to $1M | 10 to 15 stakeholders, 126 to 180 day sales cycles |
The buying committee publication (GrowthSpree, 2026) puts procurement in 62% to 78% of US enterprise deals and 85% to 94% of Indian enterprise deals. A bigger committee means a bigger buying group to reach. That pushes cost per account up and the number of accounts a team can serve down.
No published split keyed to both ACV band and team size was found. The table shows the tier-first method for each band, not percentages.
| ACV band | Published target cost per SQL (GrowthSpree, 2026) | Small team: where to start | Larger team: what to add |
|---|---|---|---|
| $15K to $50K | $1,000 to $3,000 | Fund one tier, usually 1:many, and check ACV supports named-account work | Add 1:few clusters once pipeline per account is measured |
| $50K to $150K | $3,000 to $8,000 | Fund 1:few clusters well before adding 1:1 | Add a small 1:1 tier for the largest accounts |
| $150K and above | $8,000 to $20,000 | Fund a short 1:1 tier with seller involvement | Add 1:few and 1:many tiers behind it |
Team size caps the number of accounts, which caps the ABM line. Most small teams run lists of 100 to 300 accounts (GrowthSpree, 2026; practitioner view, no stated sample). Stage matters as well. Marketing budget as a share of revenue falls from a median of 14% below $5M in revenue to 4% above $150M (Benchmarkit, 2025). Benchmarkit's authors add, "There is a direct correlation between growth rates and marketing budget allocation" (Benchmarkit, 2025).
A small team should fund fewer tiers well, not three tiers thinly. Regional splits are largely unpublished, since the benchmarks found lean toward US and European enterprise.
Building a marketing budget backward from a board pipeline target means converting the target into required opportunities and sales-qualified leads (SQLs), costing each account tier, and only then splitting spend. Benchmarkit's 2025 survey found pipeline dollars (79%) and number of opportunities (70%) are the top two marketing ROI measures (Benchmarkit, 2025), so the board's target will judge the split.
Follow these steps in order:
Verify the result by checking that tier costs, demand generation, brand, and reserves add up to the envelope. Then track pipeline per account, which is the pipeline created divided by the number of target accounts in a tier, rather than reach. The ABM measurement guide explains holdout accounts, and the attribution guide covers crediting several touches. If a dashboard shows hundreds of engaged accounts and sales sees no change, the engaged accounts versus SQLs breakdown shows why.
Every number in this table is an illustrative output of assumed inputs. None is a published benchmark. Account counts sit inside the published tier ranges above.
| Tier | Assumed size | Assumed cost | Assumed total |
|---|---|---|---|
| 1:1 | 30 accounts | $8,000 per account | $240,000 |
| 1:few | 10 clusters | $15,000 per cluster | $150,000 |
| 1:many | 300 accounts | $50 per account | $15,000 |
| ABM line | $405,000 |
Next, compare that ABM line with an envelope built from your own benchmark, such as SaaS Capital's 2026 median of 8% of ARR. The ABM share is then a ratio you compute, not a standard to copy. Swap in your own tier counts and treatment costs, and the remaining envelope covers demand generation, brand, expansion, and tools.
A tier-first budgeting approach is not for B2B SaaS companies with an annual contract value (ACV) below roughly $15K or with no seller working named accounts. Below that price point, the cost of reaching several stakeholders per account usually exceeds the return. It also cannot supply an ABM benchmark with a stated sample: Benchmarkit's 2025 brand vs demand survey reports no ABM line.

Other honest limits apply:
The median private B2B SaaS company spends 8% of annual recurring revenue on marketing, according to SaaS Capital's 2026 survey. Benchmarkit's 2025 data shows the share of revenue falls with scale, from a median of 14% below $5M in revenue to 4% above $150M. Denominators and populations differ, so match the benchmark to your stage.
Published ranges suggest 10 to 50 accounts for 1:1, 50 to 200 for 1:few, and 200 to 500 for 1:many. Most small teams run lists of 100 to 300. Lists of 500 to 2,000+ named accounts are common but typically exceed what a small team can sustain (GrowthSpree, 2026; practitioner view, no stated sample).
Demand generation targets audiences defined by persona and interest and optimizes for lead volume. Account-based marketing (ABM) targets a defined list of named companies and measures success per account. The two are not mutually exclusive: many B2B SaaS companies run demand generation alongside ABM on the highest-fit accounts.
ABM budget should be its own line, because published brand and demand splits usually have only two buckets and hide it. Benchmarkit's 2025 survey reports 70% demand generation and 25% brand with no ABM line. SaaS Capital's 2026 median selling cost of 15% of ARR may also hold ABM spend.
Sales cycle length is the floor. Published ranges are 49 to 84 days for $25K to $100K deals, 84 to 126 days for $100K to $250K deals, and 126 to 180 days for $250K to $1M deals (GrowthSpree, 2026; no stated sample). An ABM program should not be judged on pipeline before one full sales cycle has passed.
Marketing budget allocation works when the order is right. Remember these points:
To pressure-test a tiered target account list and the split behind it, Meet with an expert. It is a free consultation, so bring your target account list and brainstorm the next step with an ABM expert. For wider practice, see the ABM best practices guide.
Written by
Ishan Manchanda
Ishan Manchanda is co-founder of GrowthSpree, a B2B SaaS marketing consultancy founded in 2017 that has managed $60M+ in ad spend across 300+ B2B SaaS companies. He focuses on demand generation, go-to-market strategy and pipeline growth, and has been featured in Silicon Valley Times, SaaS Mag and the Unbounce podcast.
© 2026 abmforb2bsaas.com All rights reserved.


| Treat any ABM percentage as unverified |