Blog
Attribution Models for B2B SaaS: What Each Measures and Where It Fails
Attribution models compared by deal size, sales cycle and buying group. What first-touch, last-touch, U-shaped and W-shaped each measure and where they fail.
Published B2B SaaS sales conversion rates by ACV band: win rates from 12% to 35%, stage-by-stage funnel benchmarks, and how to project pipeline.
 Ishan ManchandaNov 4, 2026
Attribution models compared by deal size, sales cycle and buying group. What first-touch, last-touch, U-shaped and W-shaped each measure and where they fail.
Intent scores reset weekly and most ABM teams have no owner or action tied to them. Here is the workflow to act on real-time buying signals before the window closes.
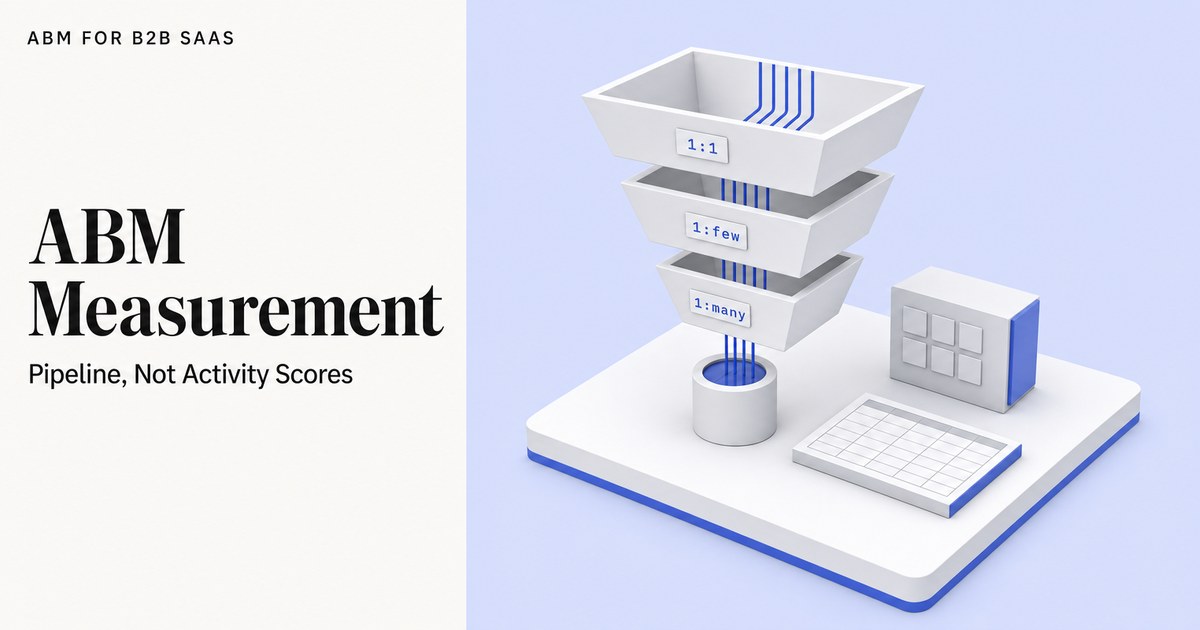
Stop tracking engaged accounts. Rebuild ABM measurement around account-to-opportunity rate and pipeline per target account, tiered by 1:1, 1:few, and 1:many.
Request a quote and our experts will contact you within 24 hours with tailored solutions and pricing.
ABM for B2B SaaS
Last updated: Nov 4, 2026
By the ABM for B2B SaaS Editorial Team. Last updated October 28, 2026. Sourcing rules are on the Methodology page.
Sales conversion rates in B2B SaaS are the share of leads, opportunities or target accounts that move to the next funnel stage, and they fall as annual contract value (ACV) rises, though studies disagree on how steeply.
Two datasets show the gap. Optifai reports win rates of 28% to 35% below $10K and 12% to 18% above $100K (Optifai, 2026). Revspire reports 35% at $10k to $20k and 30% above $100k (Revspire, 2026). A marketer building an account-based marketing (ABM) business case still has to pick a number before projecting pipeline. This guide lines up published benchmarks by stage and deal size, maps them to the $15K-$50K, $50K-$150K and $150K+ bands, and shows how to test them against your own CRM. For the measurement side, see the guide to pipeline per account.
Key Takeaways
- Optifai's study of 939 B2B SaaS companies puts win rates at 20% to 28% for $10K to $50K deals and 12% to 18% above $100K (Optifai, 2026).
- Revspire's closed-deal data from about 40 companies is flatter: 35% at $10k to $20k and 30% above $100k (Revspire, 2026). An ABM business case should model a range, not a point.
- Win rate definitions differ by source: First Page Sage reports 37% opportunity to closed for B2B SaaS (Companies History, 2026), while Ebsta × Pavilion data reported 19% for 2025 (Altify, 2025).
- ABM account-to-opportunity benchmarks are thin. One low-confidence illustration runs from 3% to 18% by account tier (Digital Applied, 2026), so measure your own rate with a frozen cohort and holdout accounts.
- Older benchmarks need a haircut: the average B2B win rate was reported at 29% in 2024 and 19% in 2025 (Altify, 2025).
Typical B2B SaaS sales conversion rates by stage, per First Page Sage's 2026 cross-industry report as reported by Companies History, are 39% lead to marketing-qualified lead (MQL), 38% MQL to sales-qualified lead (SQL), 42% SQL to opportunity and 37% opportunity to closed (Companies History, 2026). By deal size, Optifai's study puts win rates at 28% to 35% below $10K and 12% to 18% above $100K (Optifai, 2026).
Stage rates show where volume leaks. Deal-size rates show how often a late-stage deal closes. The First Page Sage cross-industry stage rates compound to roughly 2.3% lead to customer (Companies History, 2026). Two datasets cover stages:
| Funnel stage | First Page Sage, cross-industry B2B SaaS (2026) | First Page Sage, cybersecurity SaaS clients (2025) |
|---|---|---|
| Visitor to lead | Not reported | 1.6% |
| Lead to MQL | 39% | 44% |
| MQL to SQL | 38% | 38% |
| SQL to opportunity | 42% | 40% |
| Opportunity to closed | 37% | 39% |
The cross-industry column comes from a secondary summary (Companies History, 2026) of a report updated in August 2026, which ranks B2B SaaS opportunity-to-closed lowest of 30 industries. The cybersecurity column comes from First Page Sage client data published in 2025, where SQL to opportunity is 40% and opportunity to closed is 39%.
Sales conversion rate is the percentage of records at one funnel stage that reach the next stage within a set period. Annual contract value (ACV) is the yearly recurring revenue a customer contract is worth. Sales-qualified lead (SQL) is a lead that sales has accepted as worth pursuing. Win rate is the share of opportunities that end in a closed-won deal.
Both stage datasets appear to define "opportunity" late in the funnel. A 37% or 39% opportunity-to-closed rate is therefore much higher than a win rate measured from every opportunity. Do not mix the two.
Benchmark sources disagree on win rate because they divide won deals by different denominators and start counting at different funnel stages. Ebsta × Pavilion data reported by Altify shows 19% for 2025 (Altify, 2025), First Page Sage shows 37% opportunity to closed for B2B SaaS (Companies History, 2026), and Revspire shows 30% to 35% of closed deals won (Revspire, 2026).

| Win rate gate | What is counted | Published example | Source |
|---|---|---|---|
| Won ÷ all closed deals | Won deals divided by won plus lost | 30% to 35% by ACV band | Revspire, 2026 |
| Late-stage opportunity to closed | Deals that reached a late stage and then closed | 37% B2B SaaS; 39% cybersecurity SaaS clients | Companies History, 2026; First Page Sage, 2025 |
| Average B2B win rate, denominator not stated | Not specified in the secondary coverage | 19% in 2025; 29% in 2024 | Altify, 2025 |
Run this checklist before comparing any benchmark with your own numbers:
B2B SaaS win rates generally fall as annual contract value rises, but the size of the drop depends on the study. Optifai's 939-company dataset shows 20% to 28% at $10K to $50K, 15% to 22% at $50K to $100K and 12% to 18% above $100K (Optifai, 2026). Revspire's closed-deal data from about 40 companies shows 35% at $10k to $20k, falling only to 30% above $100k (Revspire, 2026).
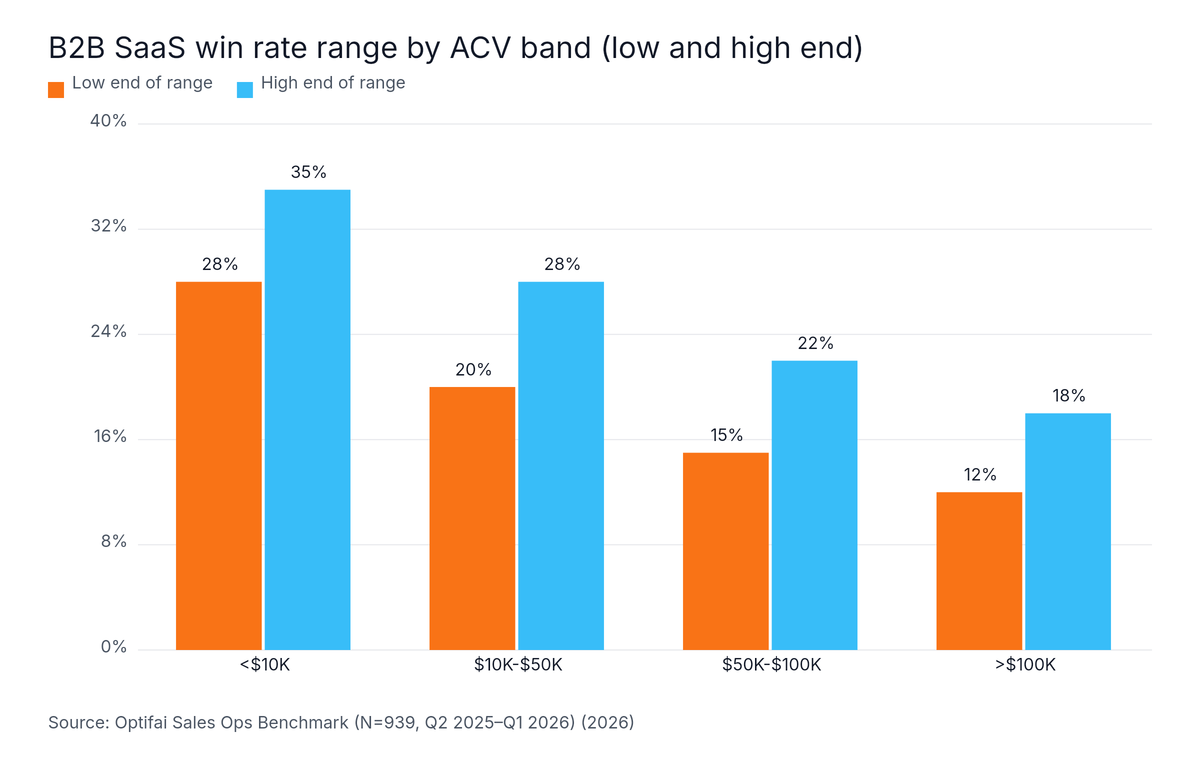
Source: Optifai Sales Ops Benchmark (N=939, Q2 2025–Q1 2026), 2026
Optifai's Sales Ops Benchmark covers 939 B2B SaaS companies using deal-level CRM data. Its ranges are the 25th to 75th percentile. The low ends are 28%, 20%, 15% and 12% across four bands (below $10K, $10K to $50K, $50K to $100K, above $100K). Pages repeating the study give inconsistent field periods, so treat the timing as approximate.
The study's own summary is blunt: "Larger deals have lower win rates but higher absolute revenue contribution." (Optifai, 2026)
Revspire's data covers closed won and lost opportunities synced from Salesforce or HubSpot between October 2025 and September 2026. It shows 35% at $10k to $20k, 33% at $20k to $100k, and 30% for both $100k to $500k and $500k and above (Revspire, 2026). The sample is about 40 companies, and the page says it shows patterns, not cause and effect. Use it as a directional counterpoint.
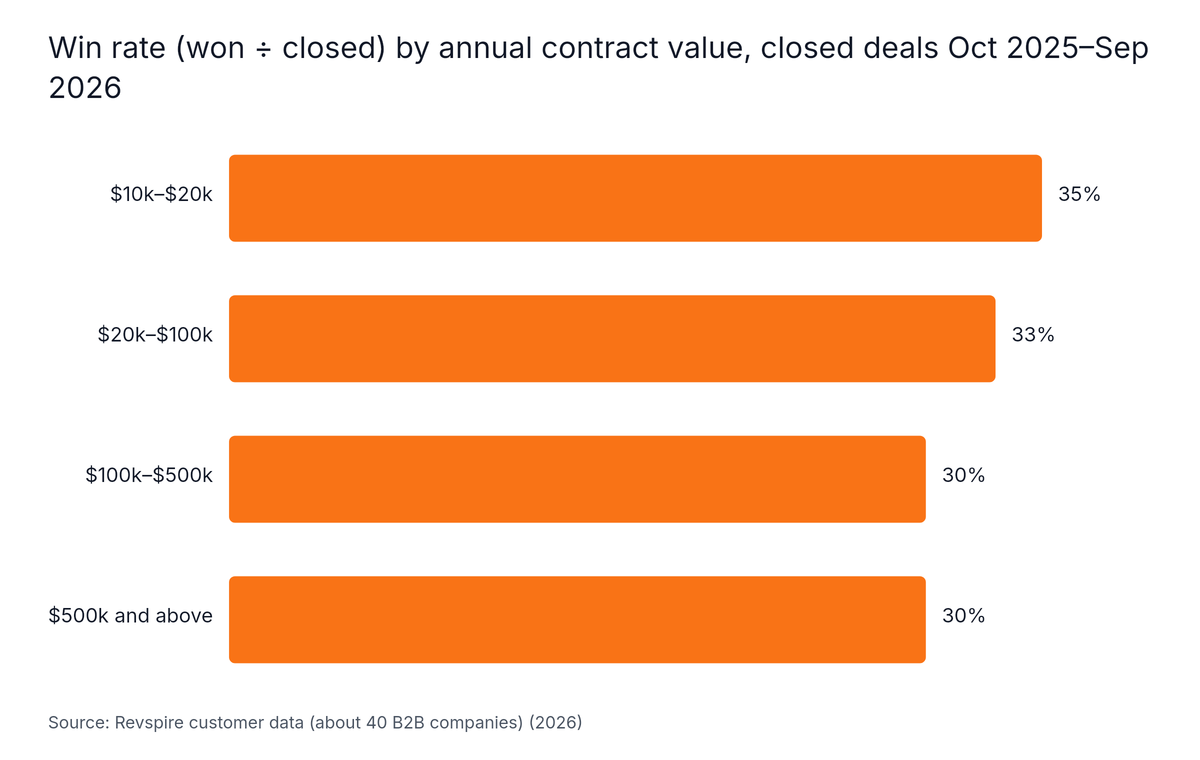
Source: Revspire customer data (about 40 B2B companies), 2026
Neither study uses the $15K-$50K, $50K-$150K and $150K+ bands, so the table uses the nearest published band and shows the full span. The span column is simple arithmetic across the cited ranges (Optifai, 2026; Revspire, 2026), not a forecast. For how these deal sizes compare with inbound-led growth, see the inbound versus ABM comparison.
| ACV band | Optifai (nearest bands) | Revspire (nearest bands) | Span of published figures |
|---|---|---|---|
| $15K-$50K | 20% to 28% ($10K-$50K) | 35% ($10k-$20k); 33% ($20k-$100k) | 20% to 35% |
| $50K-$150K | 15% to 22% ($50K-$100K); 12% to 18% (above $100K) | 33% ($20k-$100k); 30% ($100k-$500k) | 12% to 33% |
| $150K+ | 12% to 18% (above $100K) | 30% ($100k-$500k and $500k+) | 12% to 30% |
The spread is the finding. Model a low, middle and high case for each band rather than a single win rate, and replace the benchmark with your own cohort data once you have enough closed deals.
Win rates likely drop as deal size increases because larger deals involve more stakeholders, more procurement review and longer cycles, which give a deal more chances to stall. The site's published ranges (BC26, GrowthSpree, 2026, no sample stated) put 5 to 8 stakeholders in $25K to $100K deals and 10 to 15 in $250K to $1M deals.

A buying group is the set of people inside and outside a company who take part in a purchase decision. The site's published ranges (BC26, GrowthSpree, 2026, no sample stated) pair group size with cycle length:
| Deal size (ACV) | Stakeholders | Sales cycle |
|---|---|---|
| $25K-$100K | 5 to 8 | 49 to 84 days |
| $100K-$250K | 7 to 10 | 84 to 126 days |
| $250K-$1M | 10 to 15 | 126 to 180 days |
The same published ranges put procurement in 62% to 78% of US enterprise deals and 85% to 94% of Indian enterprise deals. Forrester's 2026 research is a separate study and points the same way: "The typical buying decision now includes 13 internal stakeholders and nine external influencers" (Forrester, 2026). Forrester also reports procurement as a decision-maker in 53% of cycles (Forrester, 2026).
Revspire's median for won deals, measured from opportunity creation, is 20 days under $10k ACV, 45 days at $10k to $50k and 90 days above $50k (Revspire, 2026). A quarter of the larger deals took more than 150 days. That lag sits between ABM spend and revenue. The buying group ranges and Revspire medians are measured differently, so do not stack them. Practical ways to reach more of the group are covered in the ABM best practices guide.
Average B2B win rates fell sharply in 2025. The Ebsta × Pavilion 2025 GTM Benchmarks, covering 655,000 opportunities and $48 billion in pipeline, put the average win rate at 19% in 2025, down from 29% in 2024, as reported by Altify (Altify, 2025). The win-rate denominator is not stated, so treat the drop as a direction, not an exact measure.
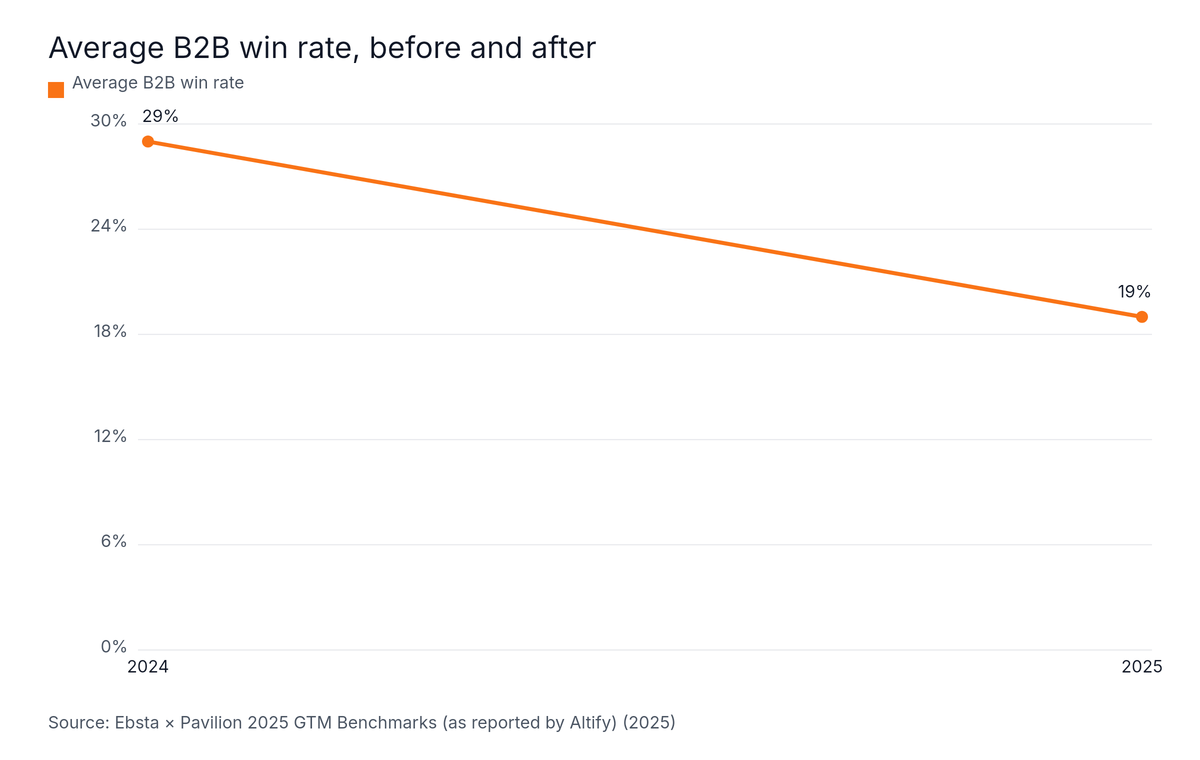
Source: Ebsta × Pavilion 2025 GTM Benchmarks (as reported by Altify), 2025
The Fullcast × Pavilion 2026 GTM Benchmarks, as reported by GTM Solutions (2026), show four moves at once:
These figures were seen on a practitioner blog, not in the gated Fullcast report (GTM Solutions, 2026), so verify them at the source before quoting them to a board. The 13.5% decline and the 29% to 19% drop come from different datasets, and neither source states a common denominator. Do not combine them.
A benchmark from 2024 describes a different market. Check the year each source measured, then model a lower case below it. If a plan uses a 2024 average of 29%, test it at 19% too, the average reported for 2025 (Altify, 2025).
A good account-to-opportunity rate for ABM has no well-sourced benchmark, so any figure is an illustration. The account-to-opportunity rate is the share of target accounts that open a sales opportunity within a set period. One agency's tier data published by Digital Applied shows 18% for Tier 1 (ACV $185K), 7% for Tier 2 ($95K) and 3% for Tier 3 ($48K), with no method stated (Digital Applied, 2026).
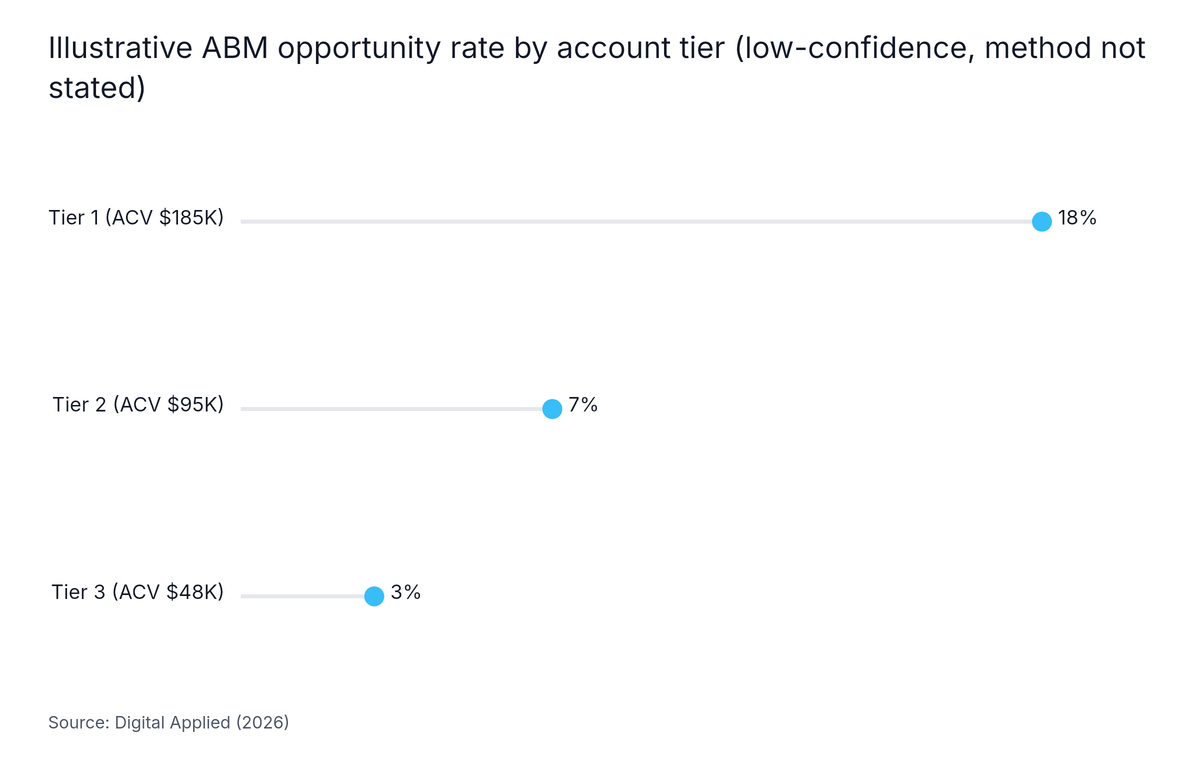
Source: Digital Applied, 2026
The tier figures are low-confidence. Another source warns that most ABM ranges are unsourced vendor estimates. The table assumes Tiers 1 to 3 correspond to 1:1, 1:few and 1:many, which the source does not state. The recommended tier sizes are the site's published ranges (ABM26, GrowthSpree, 2026, practitioner view, no sample stated).
| Account tier | Recommended size (site's published ranges) | Illustrative opportunity rate | Illustrative ACV |
|---|---|---|---|
| Tier 1 (1:1) | 10 to 50 accounts | 18% | $185K |
| Tier 2 (1:few) | 50 to 200 accounts in 5 to 15 clusters | 7% | $95K |
| Tier 3 (1:many) | 200 to 500 accounts | 3% | $48K |
The pattern is sensible: fewer accounts get more effort and open more opportunities. Do not use the numbers as targets.
Audit finding: Reach quality caps account-to-opportunity conversion. In a June 2026 audit of 56 LinkedIn accounts and $9.4M in ad spend (GrowthSpree, June 2026), decision-makers received 33% of budget against a target of 60% or more. Non-buying job functions caused 30% of wasted spend, and individual contributors and entry-level staff consumed 36% of budget.
A frozen cohort is a fixed list of target accounts locked on a start date so that later list changes cannot flatter the result. Holdout accounts are matched target accounts that receive no ABM treatment and serve as the comparison group.
The full method is in the activity-to-pipeline measurement guide.
Pipeline projection multiplies target accounts by the account-to-opportunity rate, then by win rate and ACV, and shifts the result by sales cycle length. For example, 200 target accounts at an illustrative 3% opportunity rate yield 6 opportunities, and at Optifai's 20% to 28% win-rate range for $10K to $50K deals (Optifai, 2026), about 1.2 to 1.7 closed deals. The deal counts are the article's own arithmetic.

The example uses the low end of the 1:many list range (200 accounts) and the span of published win rates for the $15K-$50K band. Each result is the article's own arithmetic.
| Step | Input | Result |
|---|---|---|
| Target accounts | 200 (1:many range is 200 to 500) | 200 accounts |
| Account-to-opportunity rate | 3% (illustrative, Digital Applied, 2026) | 6 opportunities |
| Win rate | 20% to 35% (span for $15K-$50K) | 1.2 to 2.1 closed deals |
| Time to close | 45-day median at $10k-$50k (Revspire, 2026) | Revenue lands after the cycle |
Two closed deals from 200 accounts is a sobering result. That is the reason to project before spending.
Target costs per SQL rise with deal size. They come from the site's published ranges (B26, GrowthSpree, April 2026, no sample stated). Pair them with the win-rate span to check whether a plan can pay back.
| ACV band | Target cost per SQL | Win-rate span (from the band table) |
|---|---|---|
| $15K-$50K | $1,000 to $3,000 | 20% to 35% |
| $50K-$150K | $3,000 to $8,000 | 12% to 33% |
| $150K+ | $8,000 to $20,000 | 12% to 30% |
A win rate measured on a few dozen deals carries a wide margin of error. One quarter of closed deals is rarely enough. Pool several quarters, hold the definition fixed and report a range.
Next step: Meet with an expert. A free consultation: bring your target account list and brainstorm the next step with an ABM expert.
Published B2B SaaS conversion benchmarks are not reliable for teams with only a few dozen closed deals per period, for products priced outside the studied bands, or for anyone who needs a forecast rather than a planning range. Most figures come from vendor studies, and the Revspire sample is about 40 companies (Revspire, 2026).

ABM typically pays when annual contract value exceeds $15K and at least one seller works named accounts. Below that price point, the cost of reaching and coordinating several stakeholders per account usually exceeds the return. Teams in that position should model inbound and paid acquisition first.
A good win rate at $50K to $150K ACV sits roughly between 15% and 22% on Optifai's 2026 data for deals of $50K to $100K, and between 12% and 18% above $100K (Optifai, 2026). Revspire's 2026 closed-deal data shows 30% to 33% in nearby bands (Revspire, 2026). Treat 12% to 33% as plausible, and match the definition to your own CRM.
Sources report different numbers because they count different things. Ebsta × Pavilion data reported by Altify in 2025 shows 19% with no stated denominator, while First Page Sage reports 37% opportunity to closed for B2B SaaS (Companies History, 2026), which appears to be measured late in the funnel. Match the starting stage and denominator before comparing.
A $50K+ B2B SaaS deal typically takes about 90 days from opportunity creation, based on Revspire's 2026 median for won deals above $50K, and a quarter of the larger deals took more than 150 days (Revspire, 2026). The site's published ranges (BC26, GrowthSpree, 2026, no sample stated) put $100K to $250K deals at 84 to 126 days and $250K to $1M deals at 126 to 180 days.
No fixed number of closed deals makes a win rate reliable, but more deals narrow the range of likely values, and one quarter is rarely enough. Pool several quarters, keep the stage definition fixed, and report win rate as a range rather than a single point.
ABM is measured on pipeline using account-to-opportunity rate and pipeline per target account, compared against a matched set of holdout accounts that received no ABM treatment. Engagement scores and accounts reached are activity metrics, not outcome metrics, and do not demonstrate ABM's contribution to revenue.
Sales conversion rates depend on the deal size you sell and on the definition each source uses. Before building an ABM business case, settle these points:
Next step: Meet with an expert and bring your target account list.
Continue learning
Written by
Ishan Manchanda
Ishan Manchanda is co-founder of GrowthSpree, a B2B SaaS marketing consultancy founded in 2017 that has managed $60M+ in ad spend across 300+ B2B SaaS companies. He focuses on demand generation, go-to-market strategy and pipeline growth, and has been featured in Silicon Valley Times, SaaS Mag and the Unbounce podcast.
© 2026 ABM for B2B SaaS All rights reserved.